Chapter 5 Differential gene expression analysis
5.1 Differential gene expression analysis
Let’s now focus on identitying markers that can distinguish the different cell types in the dataset. Let’s use the function FindAllMarkers.
# must switch back to SCT to identify variable markers
Seurat::DefaultAssay(ST011) = "SCT"

# find markers
all_markers = Seurat::FindAllMarkers(
    ST011,
    only.pos = TRUE,
    min.pct = 0.25,
    logfc.threshold = 0.25
)
Let’s check the top markers for each identified.
## # A tibble: 961 × 7
## # Groups:   cluster [12]
##        p_val avg_log2FC pct.1 pct.2 p_val_adj cluster gene
##        <dbl>      <dbl> <dbl> <dbl>     <dbl> <fct>   <chr>
##  1 0               1.62 0.75  0.409 0         0       MT1F
##  2 0               1.65 0.878 0.624 0         0       MT1G
##  3 0               1.04 0.97  0.913 0         0       MT1E
##  4 3.14e-293       1.58 0.375 0.145 7.04e-289 0       WIF1
##  5 1.99e-291       1.00 0.728 0.506 4.46e-287 0       ETNPPL
##  6 1.40e-286       1.12 0.592 0.325 3.14e-282 0       SLC14A1
##  7 8.73e-276       1.14 0.57  0.311 1.96e-271 0       GJB6
##  8 2.60e-234       1.49 0.334 0.135 5.82e-230 0       AL121820.2
##  9 2.02e-190       1.00 0.509 0.298 4.52e-186 0       TNS3
## 10 2.57e-115       1.08 0.276 0.138 5.76e-111 0       TBC1D16
## # ℹ 951 more rows
Let’s visualize the top 6 in a UMAP plot.
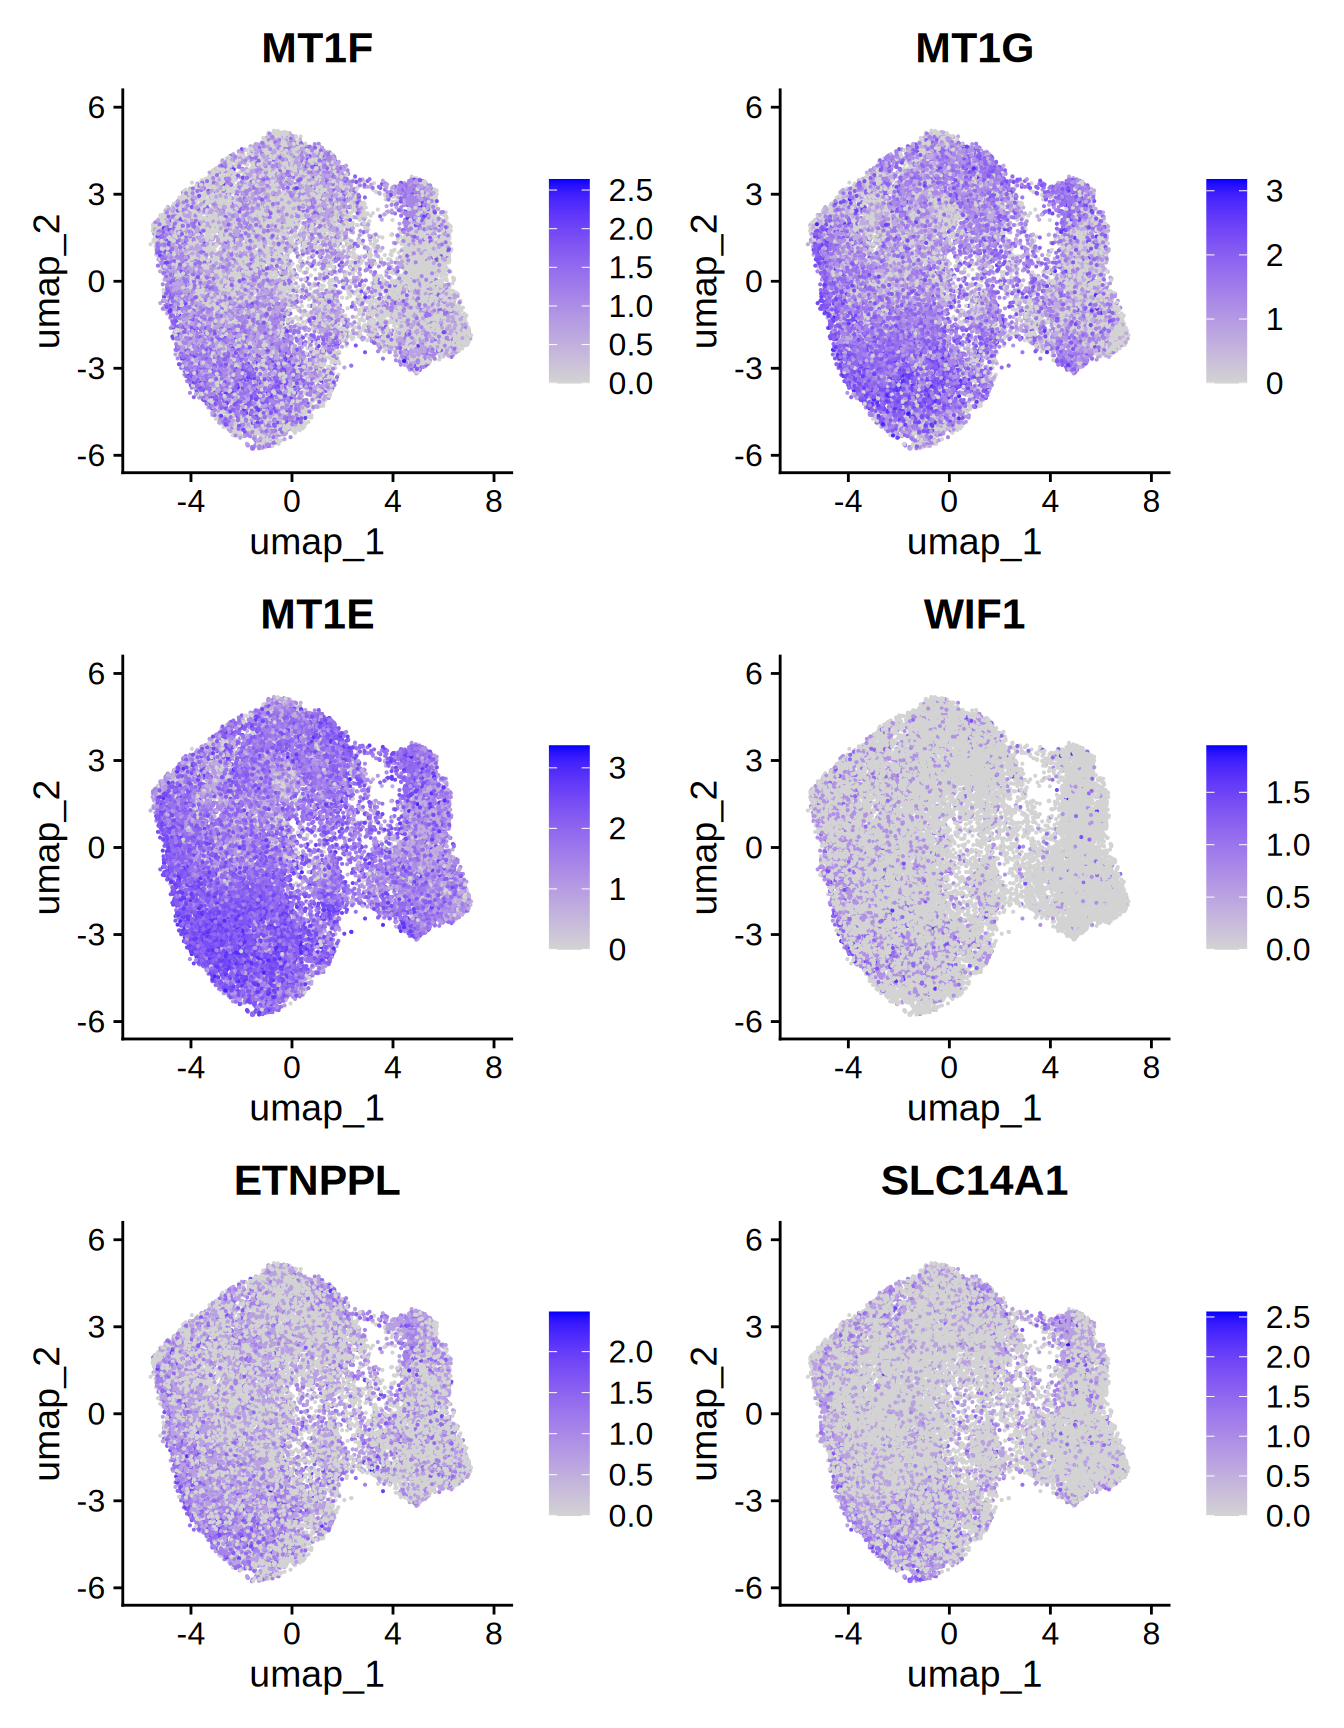
Figure 5.1: Top 6 markers
Let’s visualize the top 10 markers that differentiate between clusters with a heatmap.
# get the genes
top10_genes = all_markers %>%
    group_by(cluster) %>%
    dplyr::filter(avg_log2FC > 1) %>%
    slice_head(n = 10) %>%
    ungroup()

# plot
p1 = Seurat::DoHeatmap(ST011, features = top10_genes$gene) + NoLegend()
p1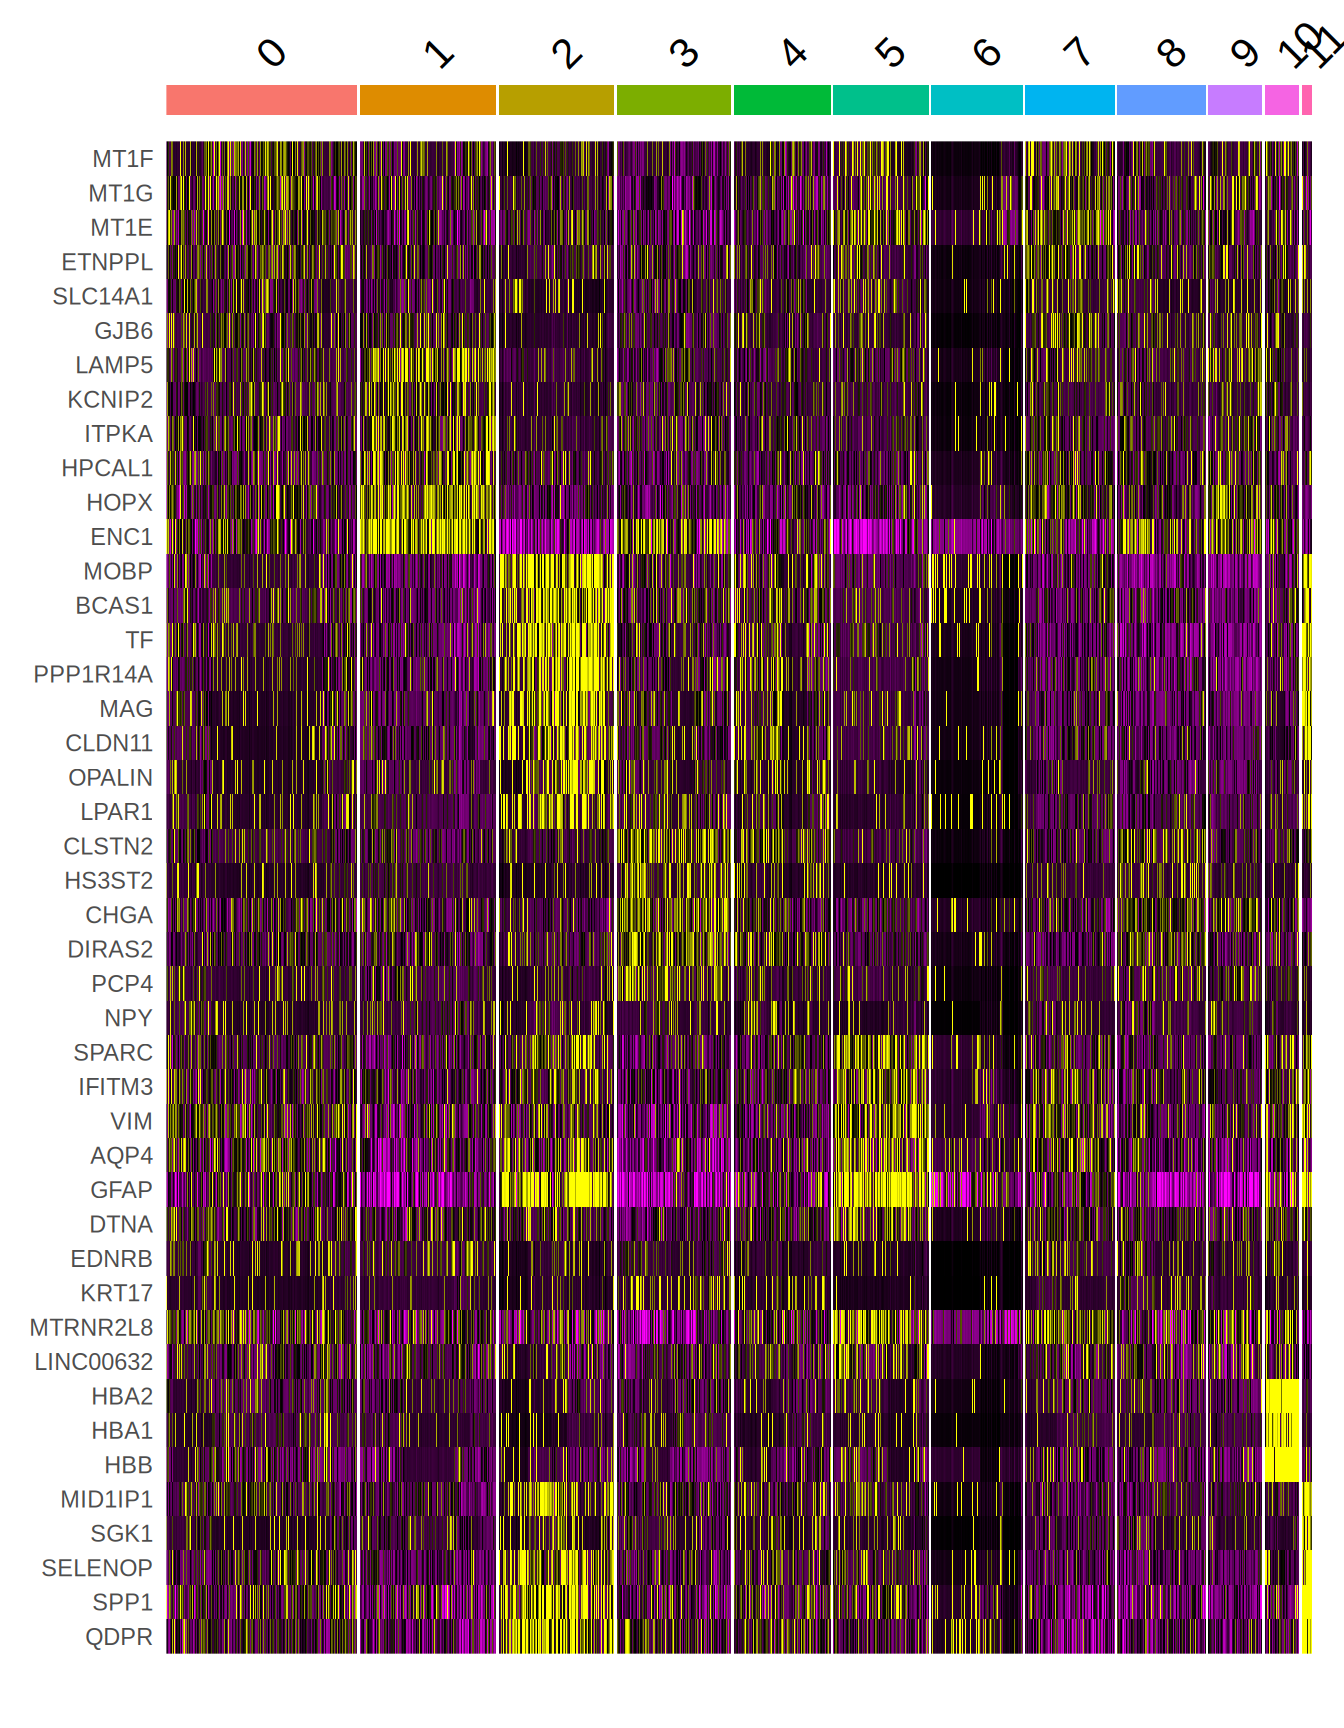
Figure 5.2: Top markers heatmap
We can also check the distribution of the top 10 markers across the different samples and groups.
Seurat::DotPlot(
    ST011,
    features = unique(top10_genes$gene),
    split.by = "orig.ident",
    cols = c("indianred", "brown2", "firebrick", "#BCD2EE", "lightskyblue3", "dodgerblue")
) + RotatedAxis()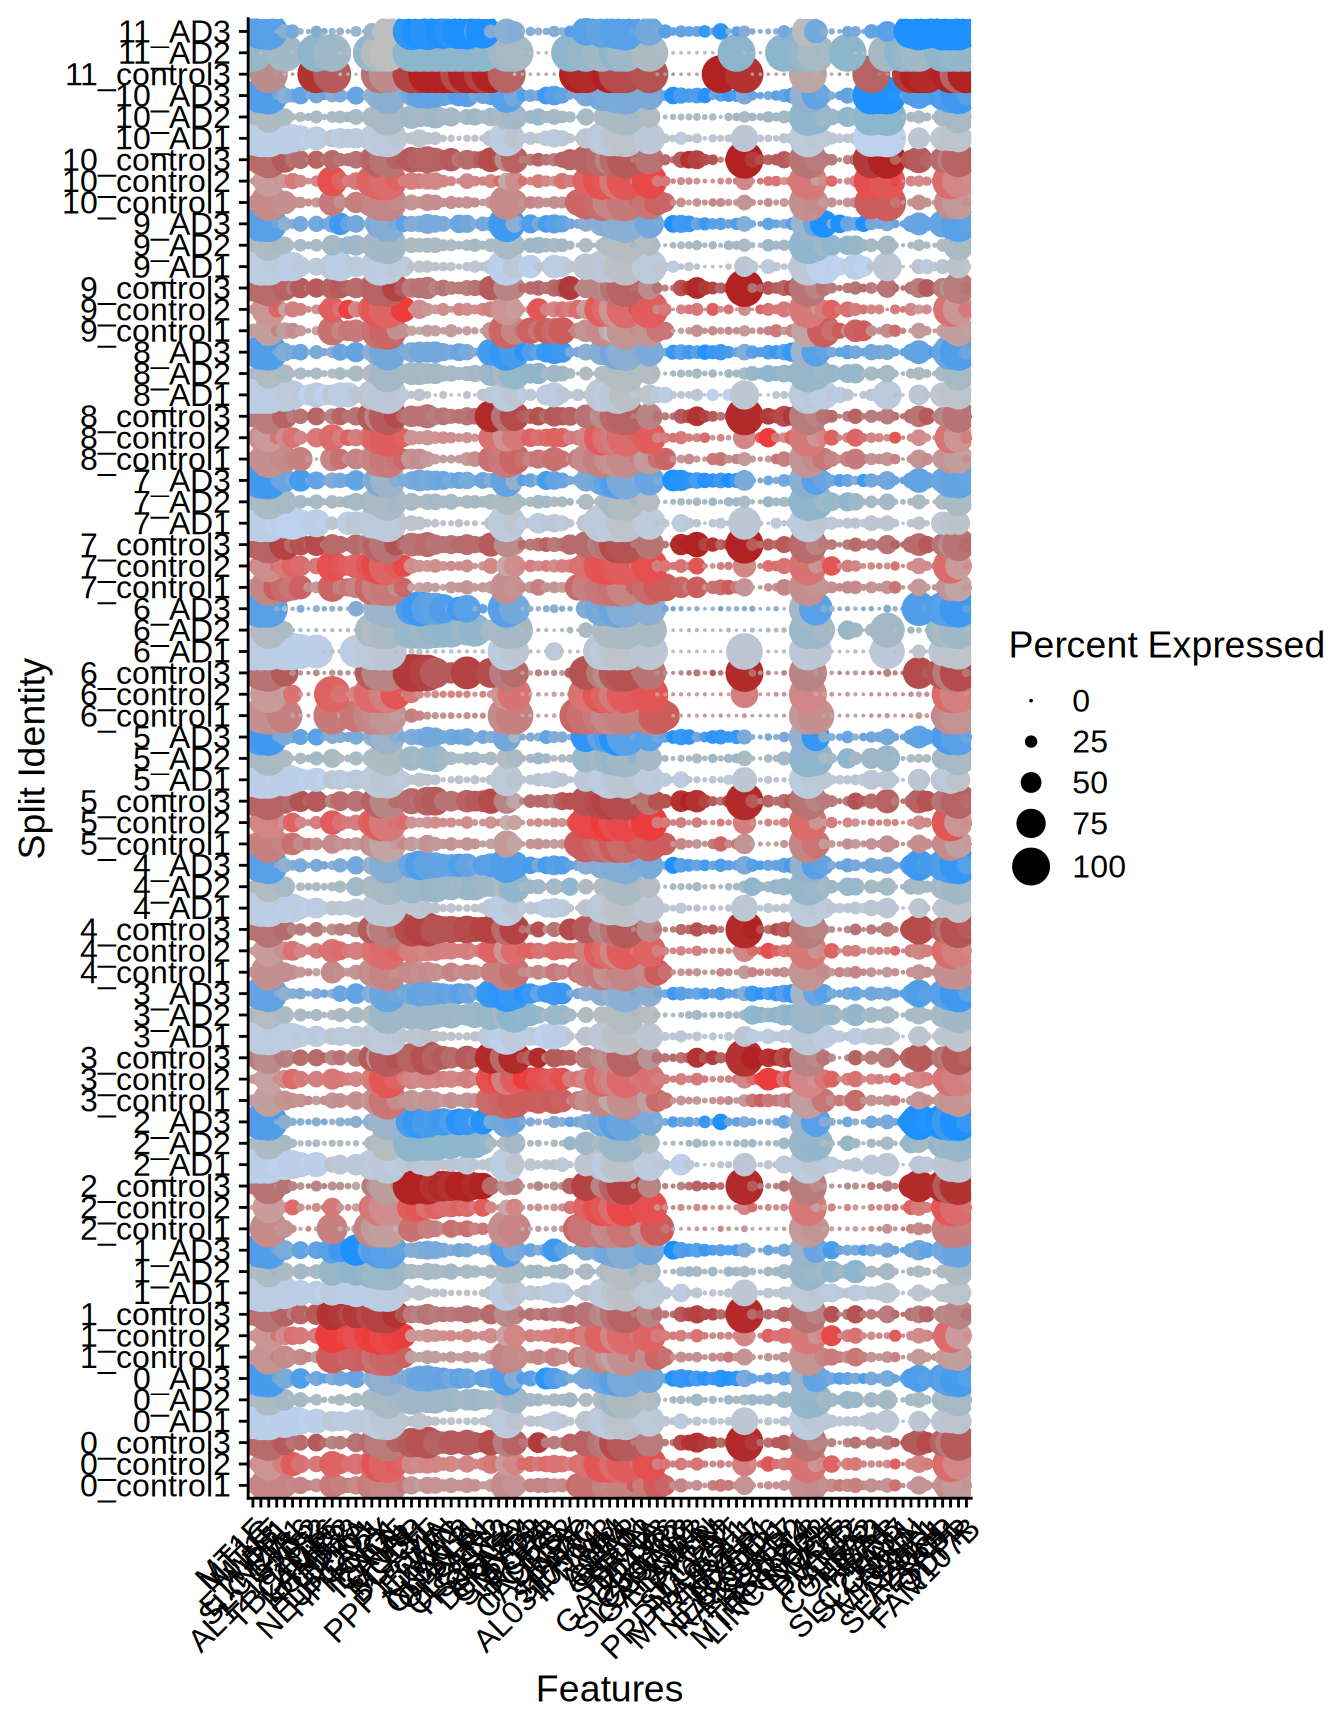
Figure 5.3: Dotplot top markers per sample
Seurat::DotPlot(
    ST011,
    features = unique(top10_genes$gene),
    split.by = "seurat_clusters",
    cols = c(brewer.pal(8, "Set2"), brewer.pal(8, "Dark2"))
) + RotatedAxis()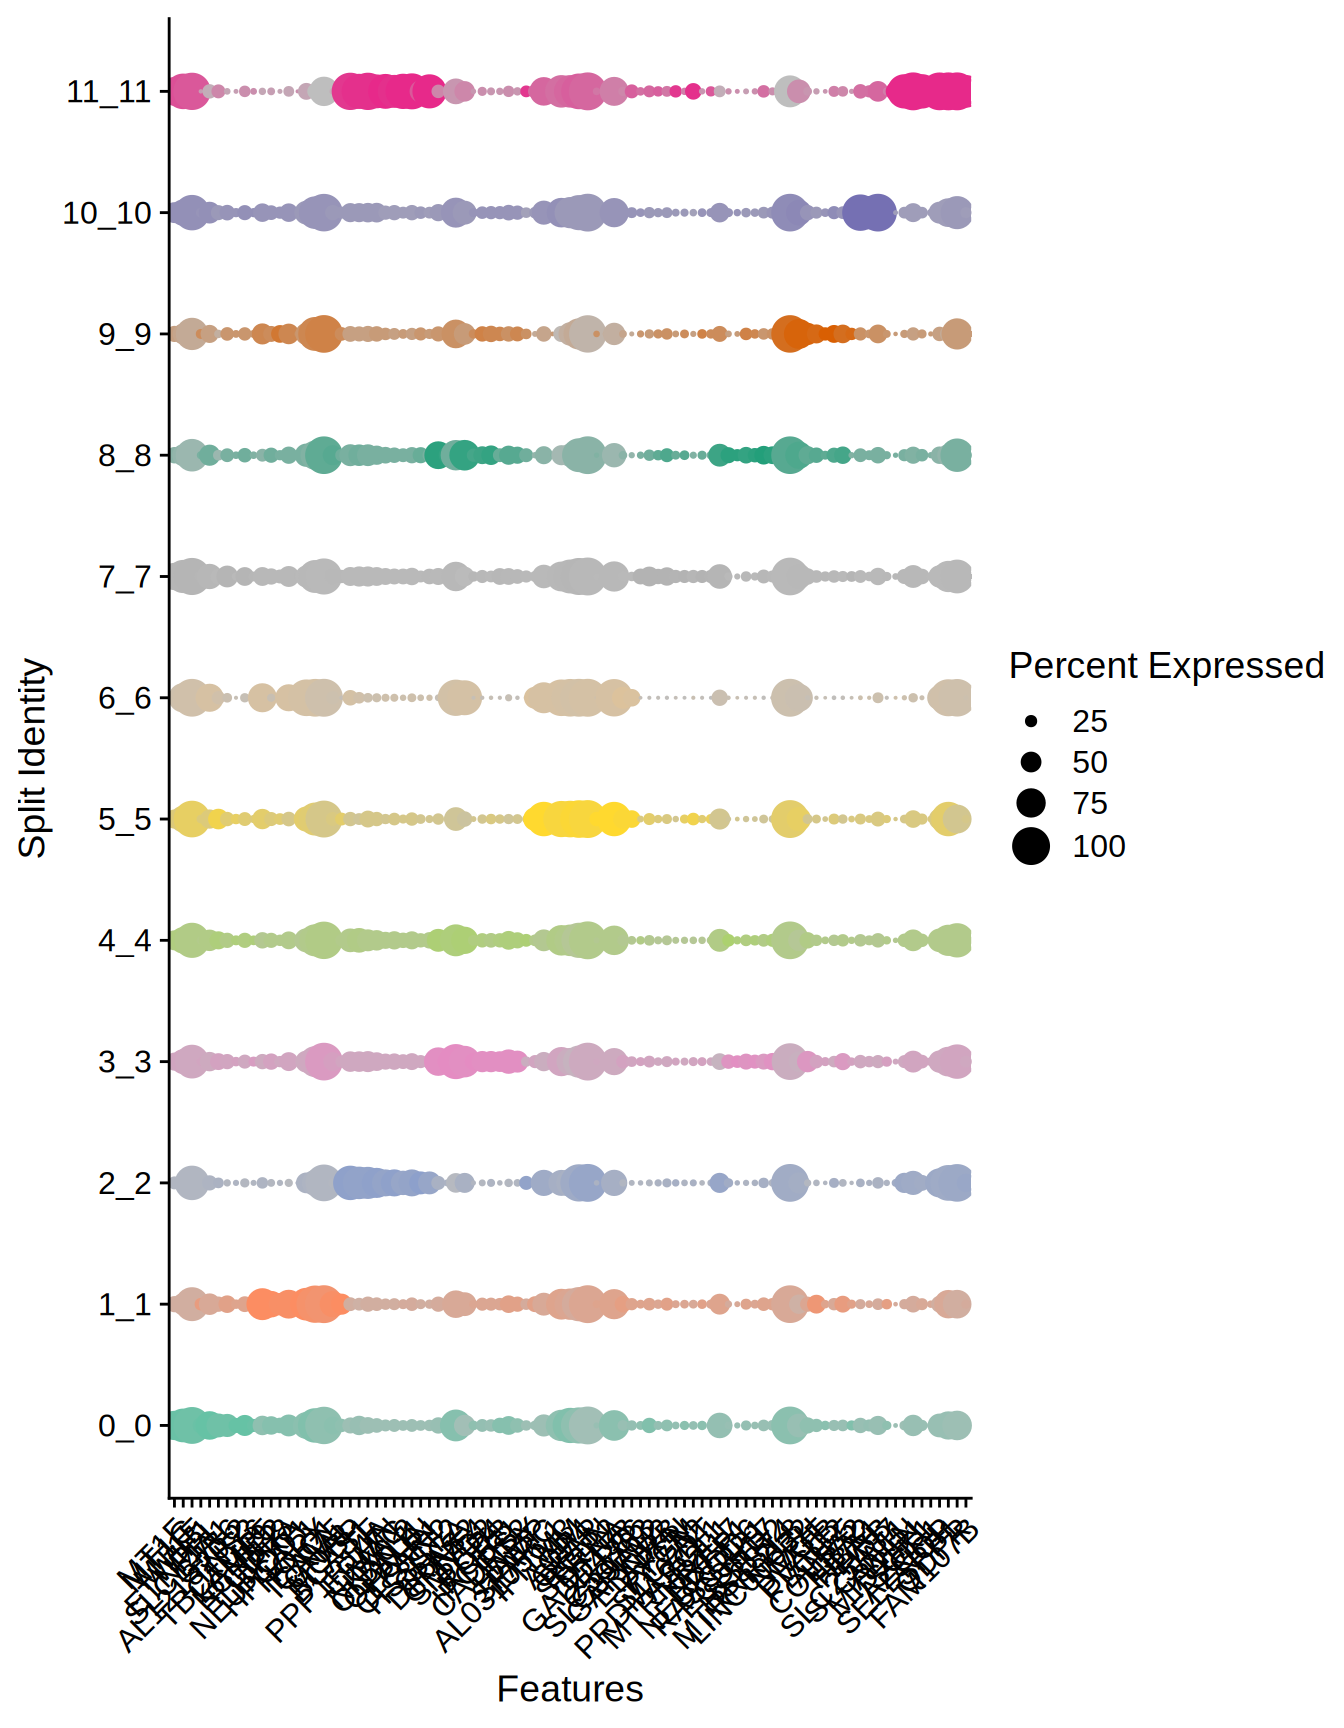
Figure 5.4: Dotplot top markers per cluster