5 Genomics and Epigenomics Analysis
5.1 On this page
Biological insights and take-home messages are at the bottom of the page at Lesson Learnt: Section 5.5.
- Here we investigate all the genomics and epigenomics data available for the three kidney carcinomas.
- First, we analyse the gene Copy Number Variants (CNVs).
- We test CNVs distribution across the three kidney carcinomas and investigate any signature associated with them.
- We perform some exploratory analyses on samples, CNVs and clinical covariates.
- The, we look into the somatic mutations detected across the three kidney carcinomas.
- We test the somatic mutations distribution across the three kidney carcinomas and investigate any signature associated with them.
- We perform some exploratory analyses on samples, somatic mutations and clinical covariates.
- Finally, we focus on DNA methylation and epigenomics signals.
- We perform a QC on probe intensities (corresponding to CpG islands different methylation levels), their distribution across samples and we impute eventual missing values.
- We do some exploratory analyses on samples, probe intensities and clinical covariates.
- We then run a formal Differential Expression analysis to identify probes that have different methylation levels across the three Kidney cancer types, and the genes associated to them.
- We perform Gene Set Enrichment Analyses on the genes associated with differentially methylated CpG islands to investigate biological and molecular themes that discriminates between the three Kidney cancer types.
5.2 Copy Number Variants (CNVs)
5.2.1 Filtering & QC
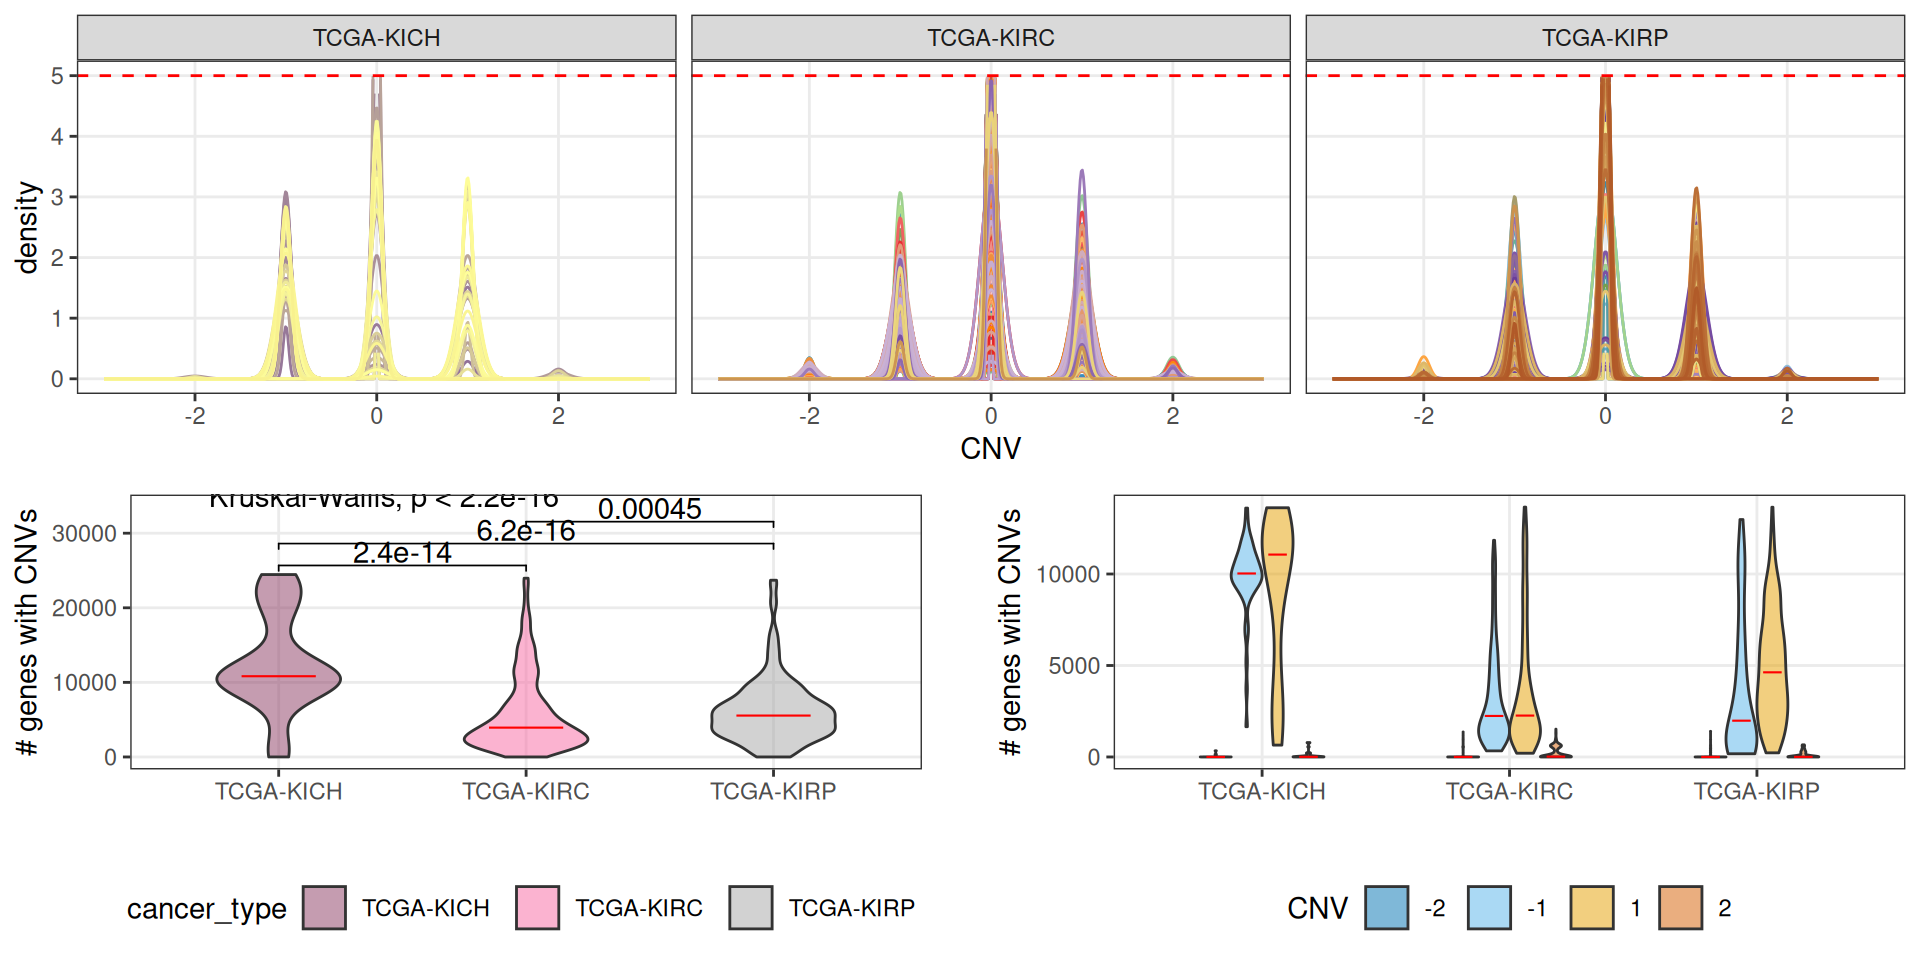
The copy number variants are available at TCGA as information collapsed at the gene level. CNVs information are reported for 24,776 genes. For each gene, we have an integer value ranging from -2 (complete deletion of the genomic region) to +2 (complete duplication of both alleles), with 0 indicating no CNV event for that gene.
All of the 24,776 reported genes are affected by at least a CNV event across 877 kidney carcinomas samples, only for 10 samples we do not have CNV information.
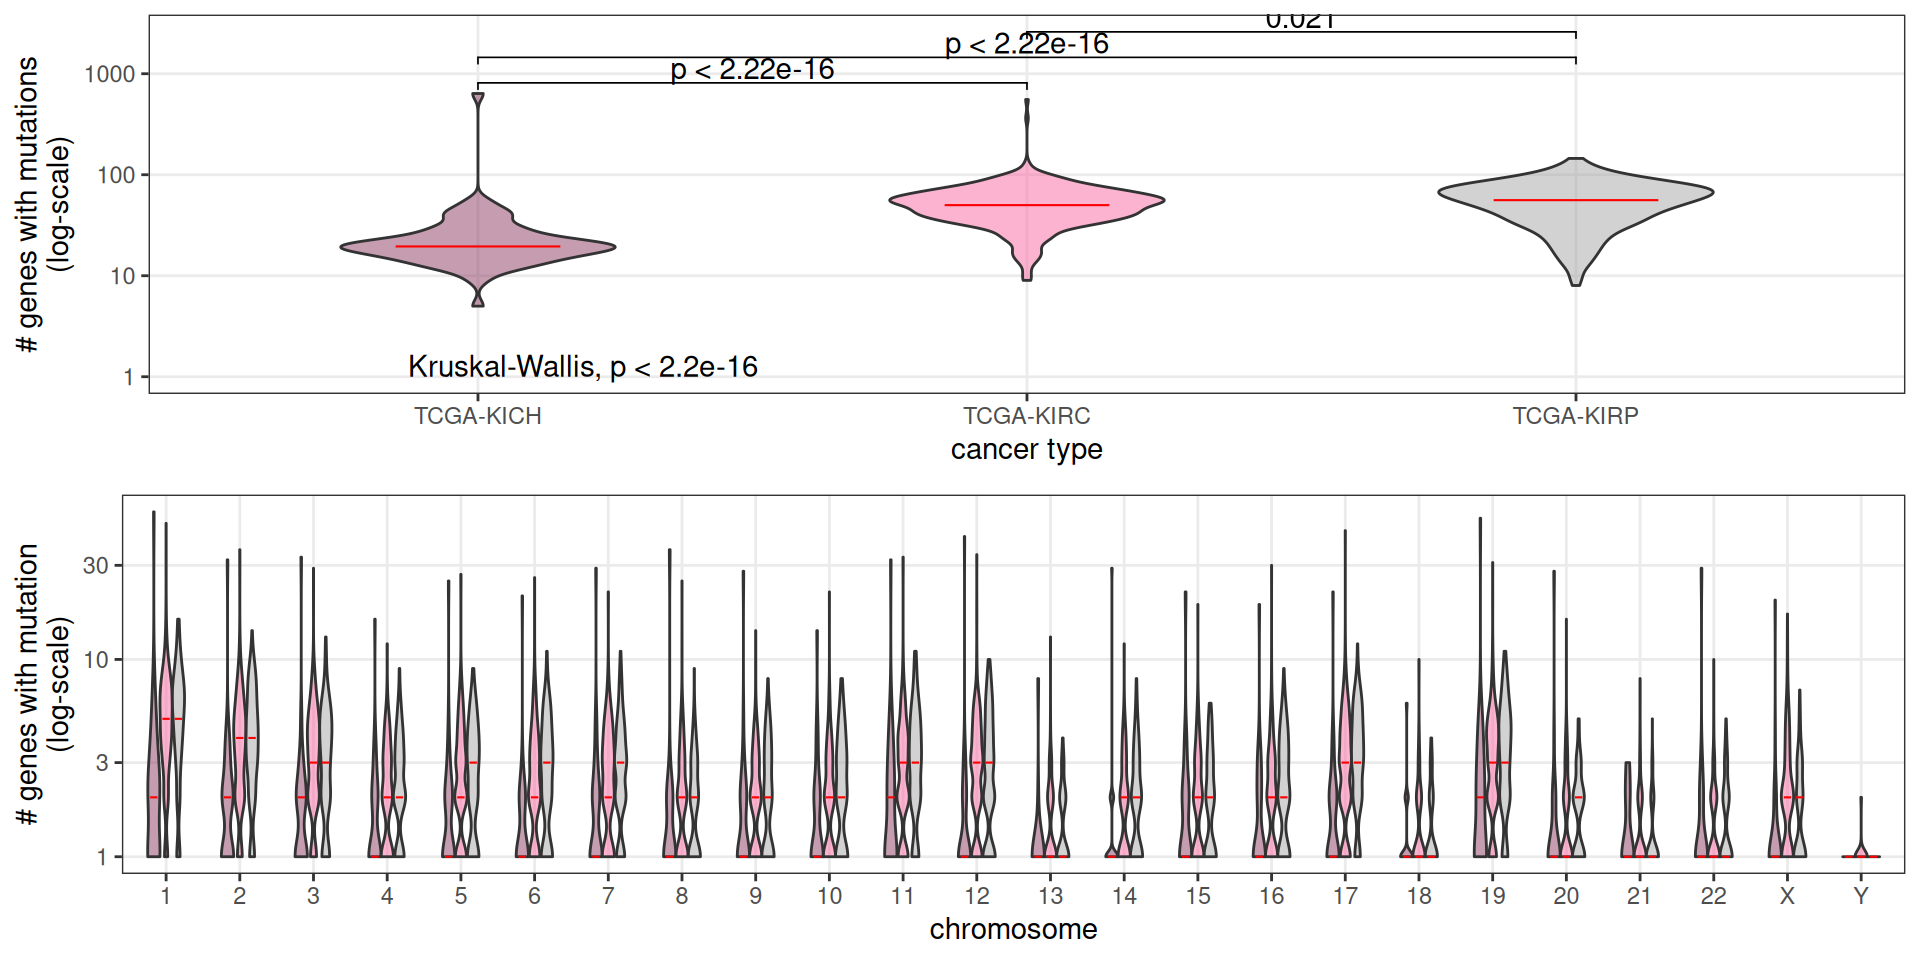
Patients affected by KICH kidney carcinomas seem to have a significantly higher number of genes affected by CNVs, followed by KIRP patients. KIRC patients have the least amount of genes affected by CNVs. In KICH and KIRP patients, also, CNVs involving gene duplications are more abundant than the ones involving gene deletions.
5.2.2 CNVs signatures across Kidney cancers
Let’s now investigate the presence of any CNV signature across the three kidney carcinomas. As mentioned before, the provided TCGA CNVs data are reported at the gene level, but obviously, Whole Genome Duplication or Chromosomal Aberration events would usually be larger than a single gene and span several genes. Since we do not have access to the raw genomics data, a first naive approach would be to walk each chromosome and bridge together as single CNV event regions between consecutive genes having the same CNV score as reported by TCGA. This would allow to collapse the information of 24,776 different segments (the reported genes) into tens or hundreds of long, consecutive genomics ranges. The approach would work well under the assumption that large CNV events are much more likely to happen than short, isolated CNV events, i.e.: spanning just one or few genes. Moreover, the available CNV data are limited to the gene level (~1-2% of total human genome length), which implies that we have no direct information on CNV events (or lack thereof) over 98% of the genome. So, we have decided to do not bridge the genomic regions across consecutive genes with the same CNV score as single CNV events, and keep the downstream CNV analyses at the gene level.
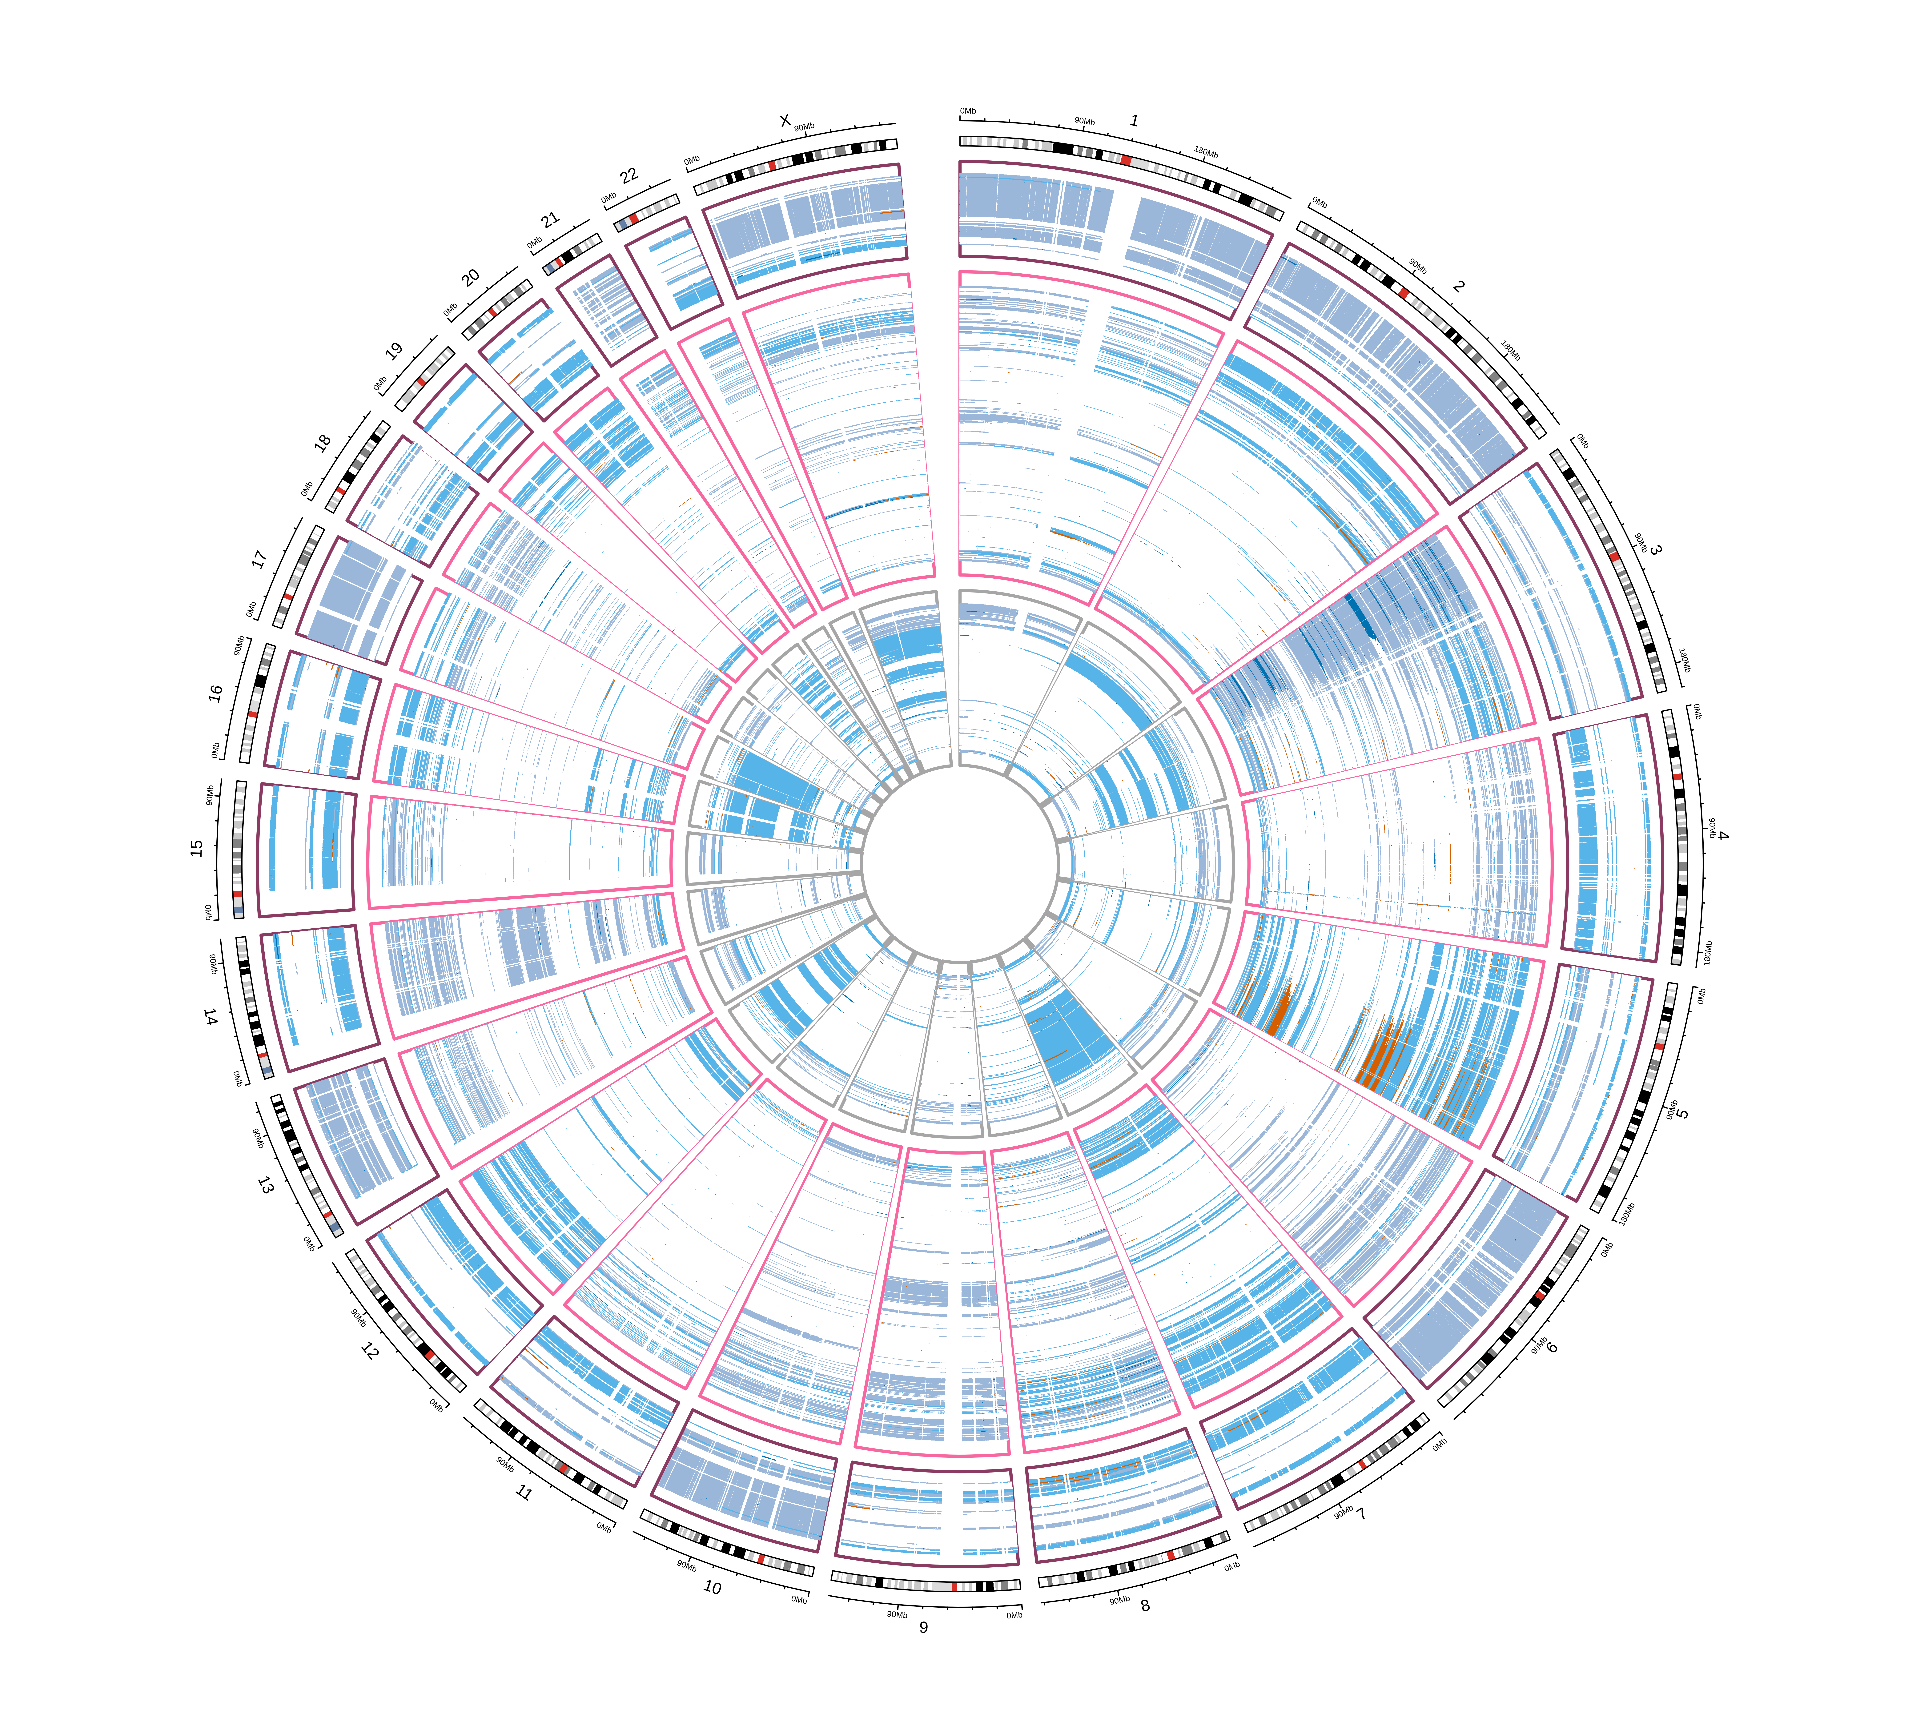
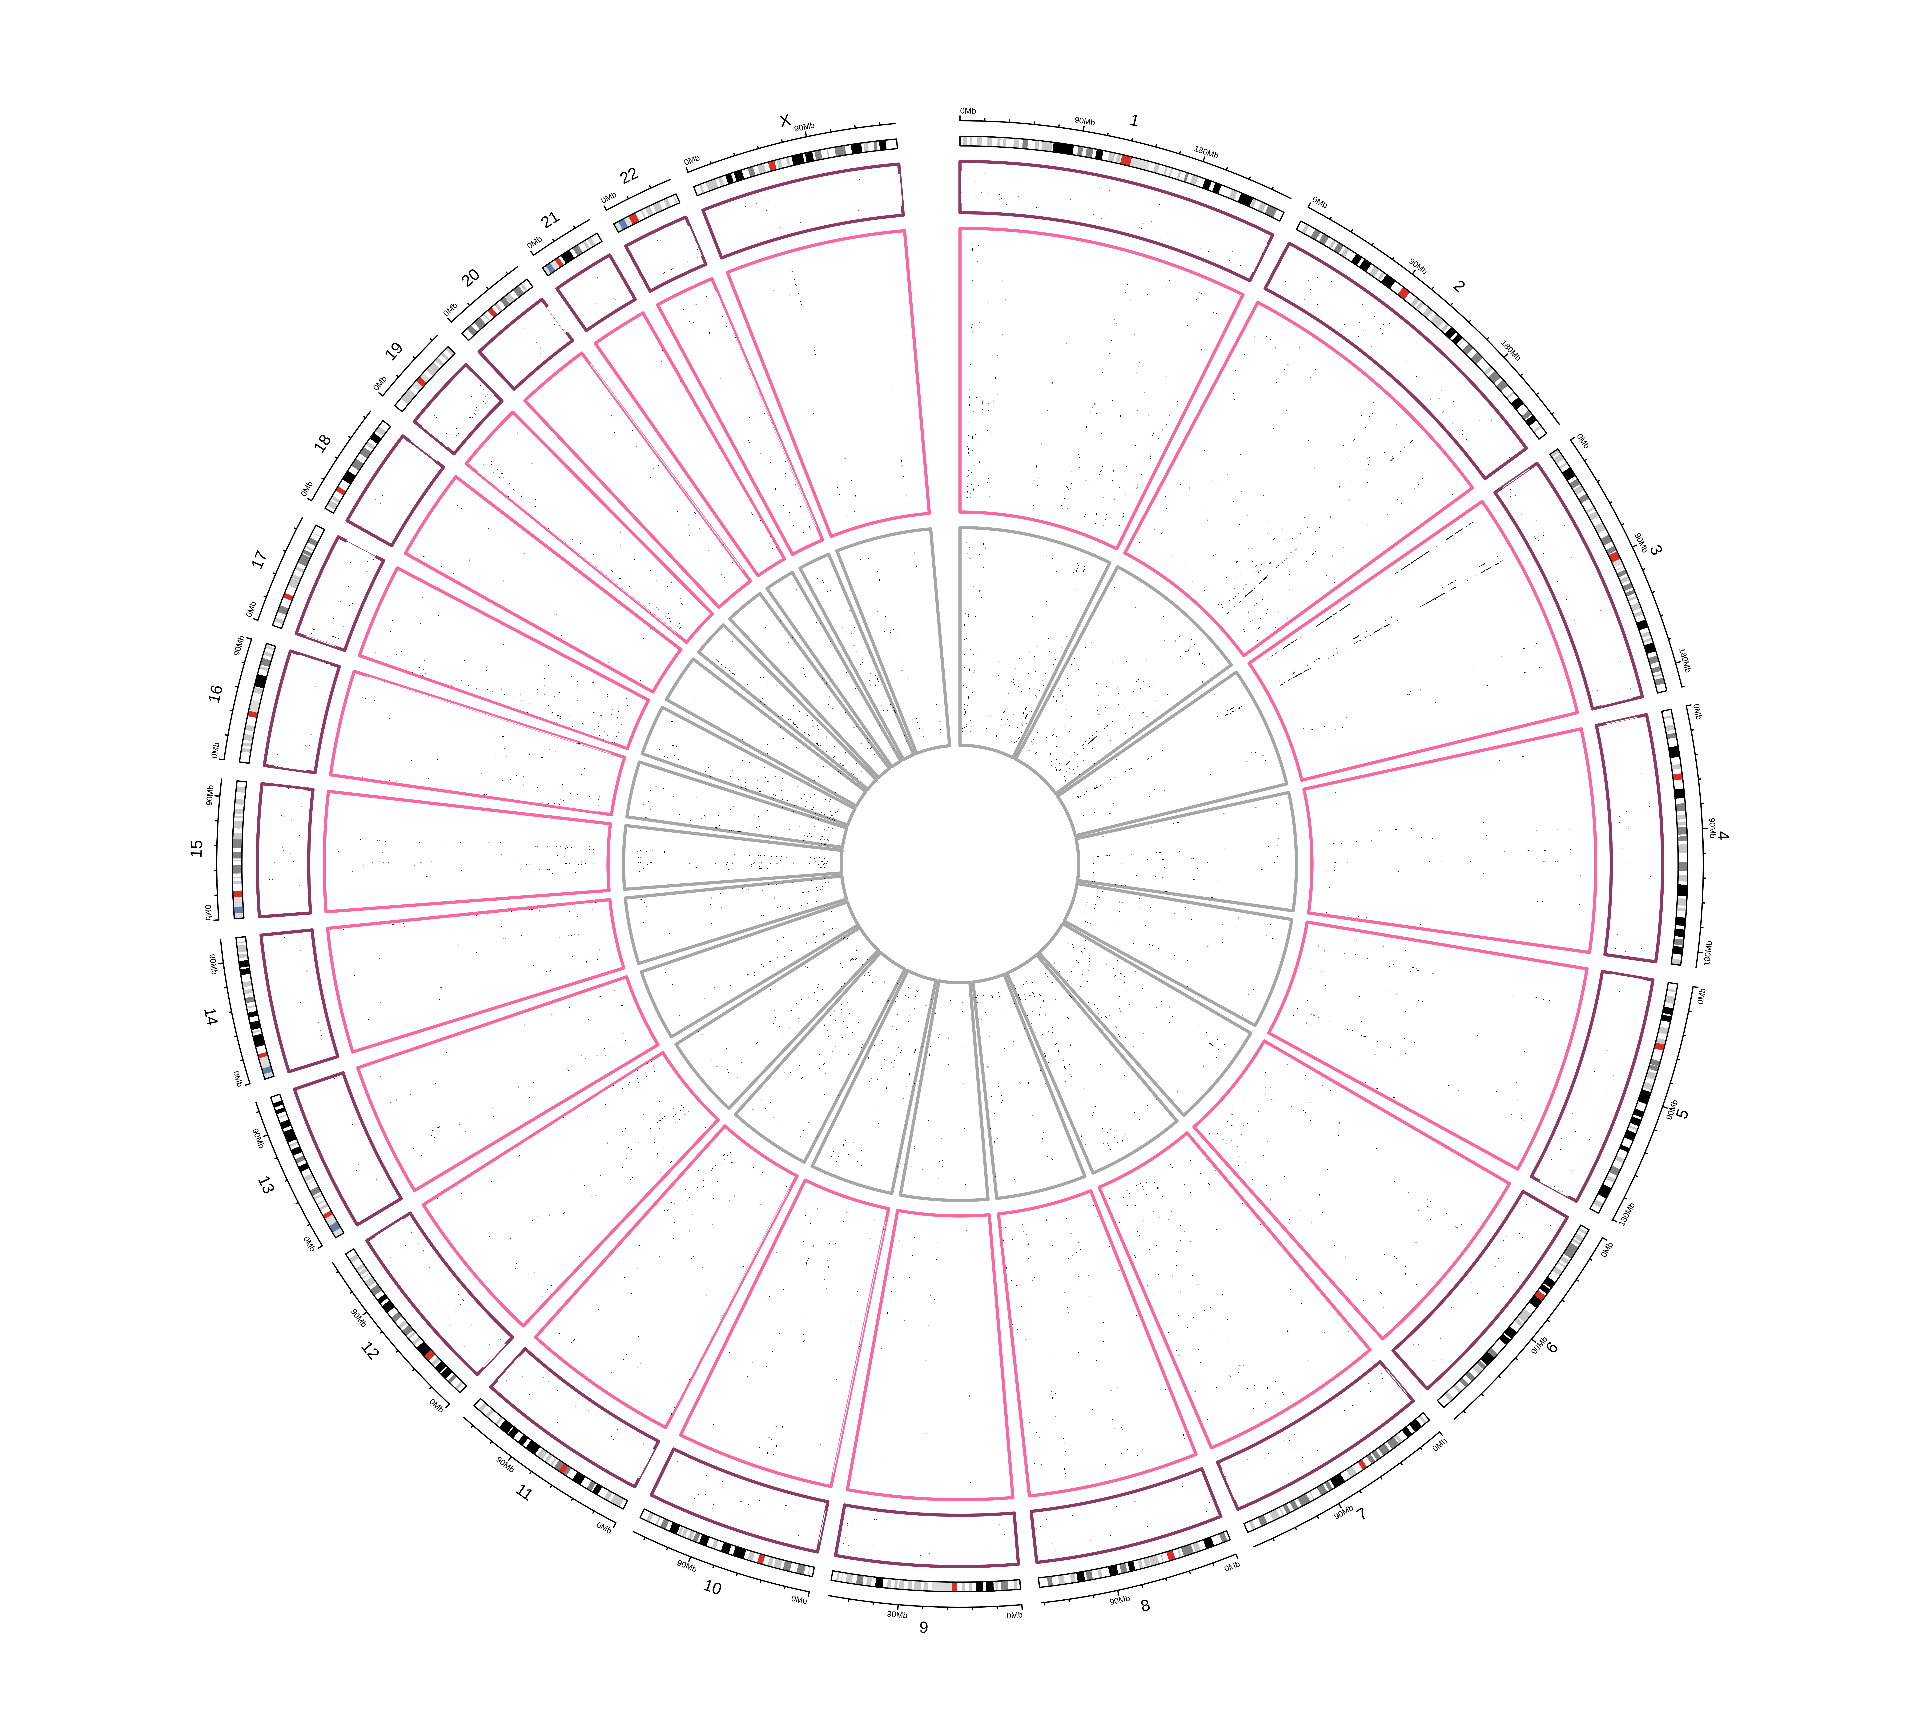
As seen in Figure 1, biopsies from KICH patients show extensive CNV events that seems to span most of the coding genome. CNVs events seems to have similar patterns across the different kidney carcinomas, and they appear to span full-length chromosomes. Within each kidney carcinoma type, it seems like biopsies could be clustered in different subtypes dependeing on their CNV signatures.
In the next steps, we will try to correlates these CNV signatures to other clinical covariates.
5.2.3 Dimesionality Reduction and Dataset Exploration
5.2.3.1 Principal Component Analysis (PCA)
As we did for the other omics data, the next step in the dataset exploration is to perform the Principal Component Analysis.
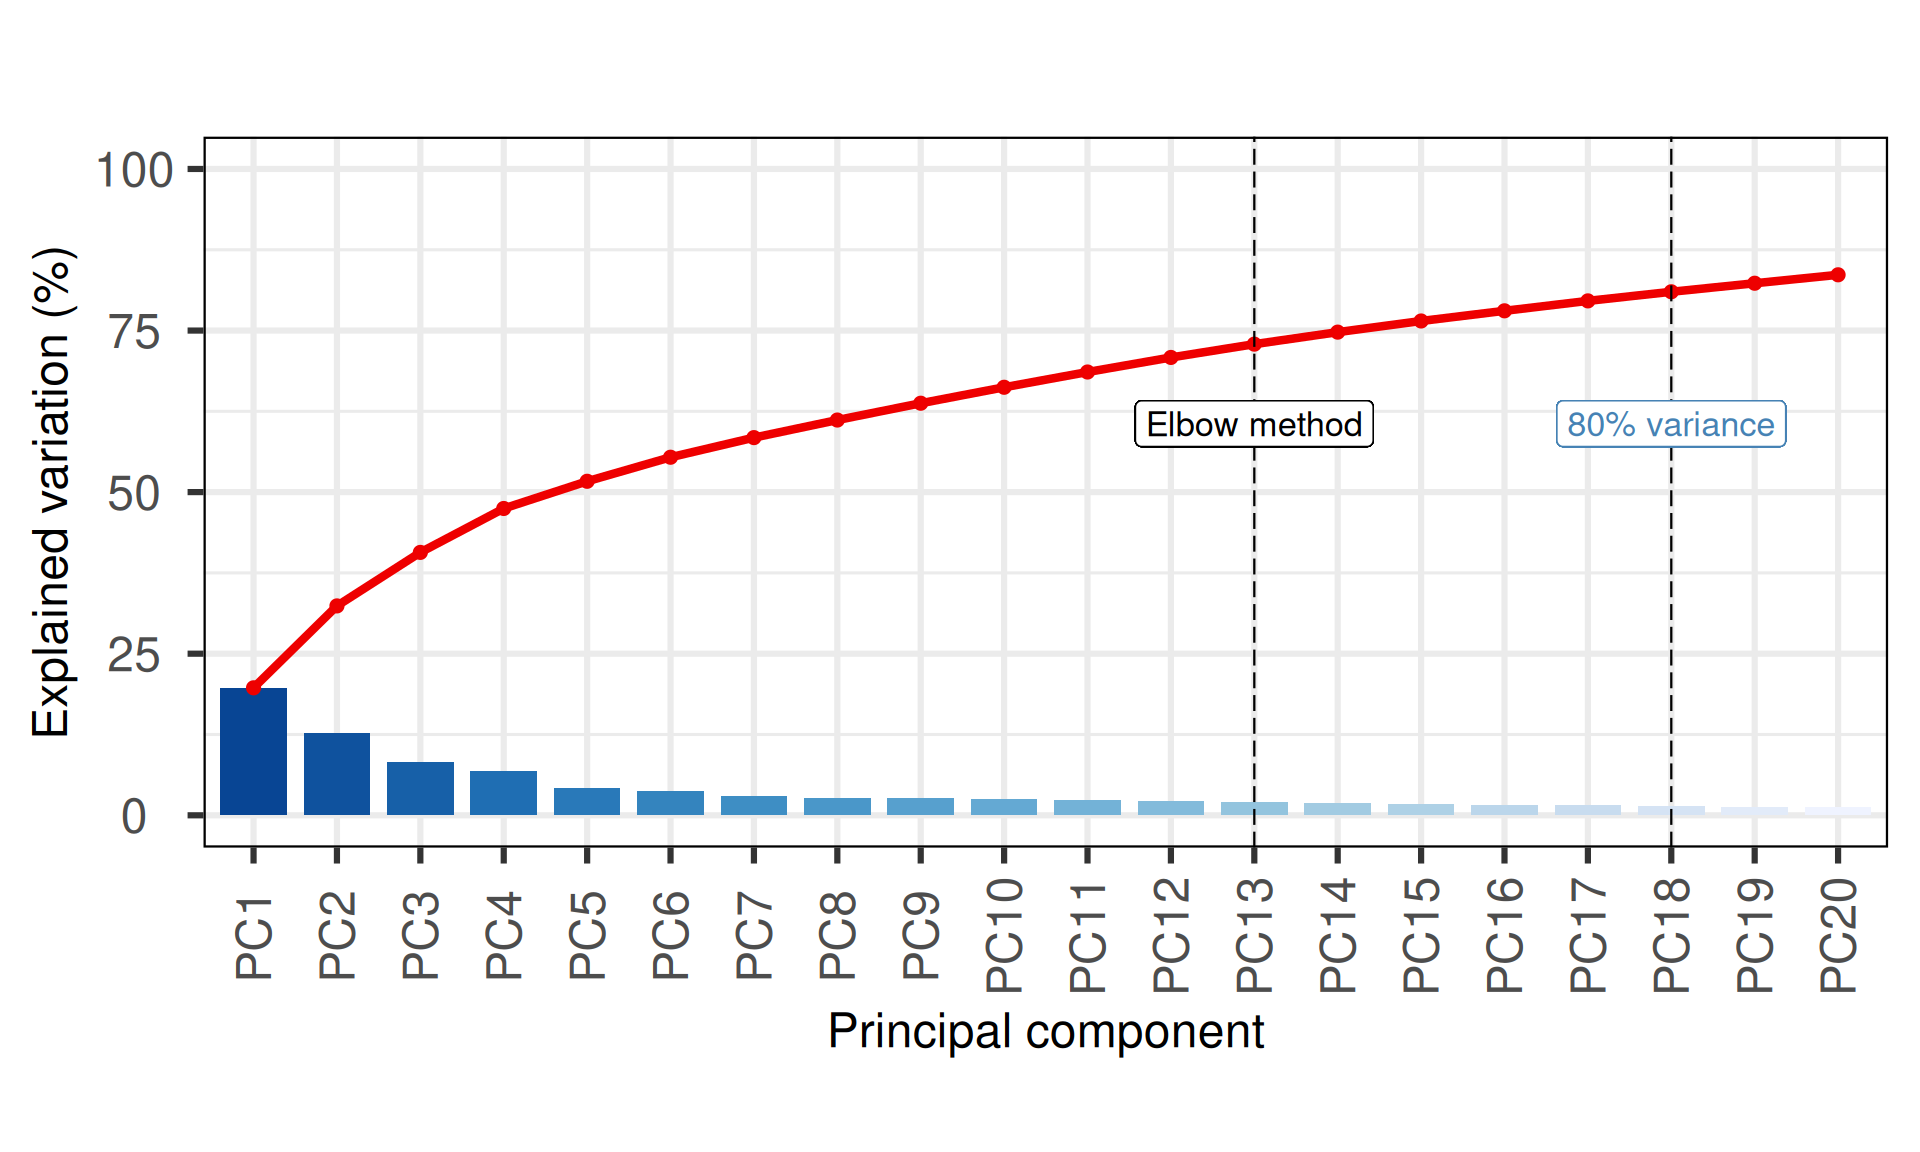
The first 18 Principal Components capture more than 80% of the variance in the Kidney cancers CNVs dataset, with the first two components (PC1 and PC2) capturing a bit more than 33% of the variance.
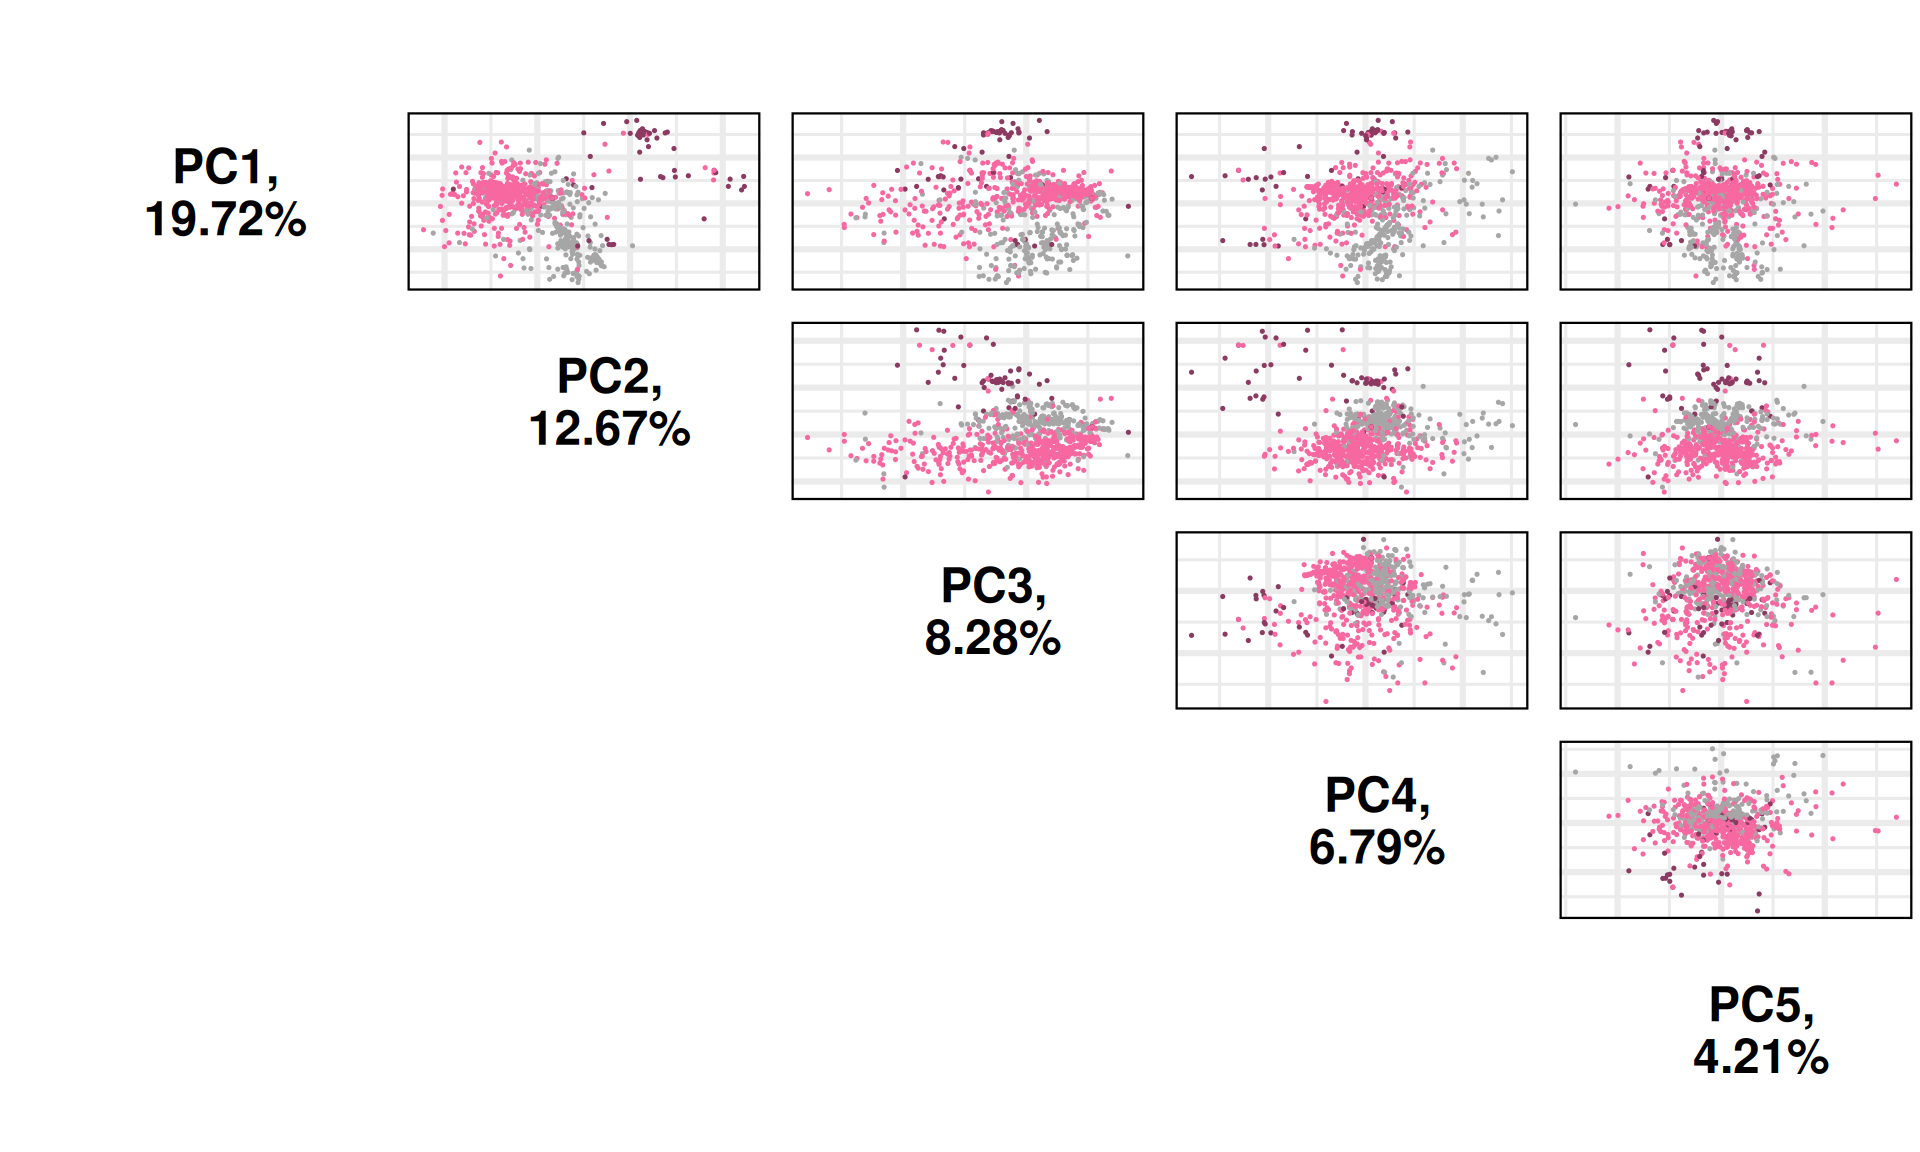
When we project the samples in the PC1 and PC2, we can see that the PC1 separates KIRC, KICH and KIRP, which instead cluster together. As observed in the UMAP, the clustering is more noisy than what observed for the other omics analyses (transcriptomics, proteomics and micro-RNAs).
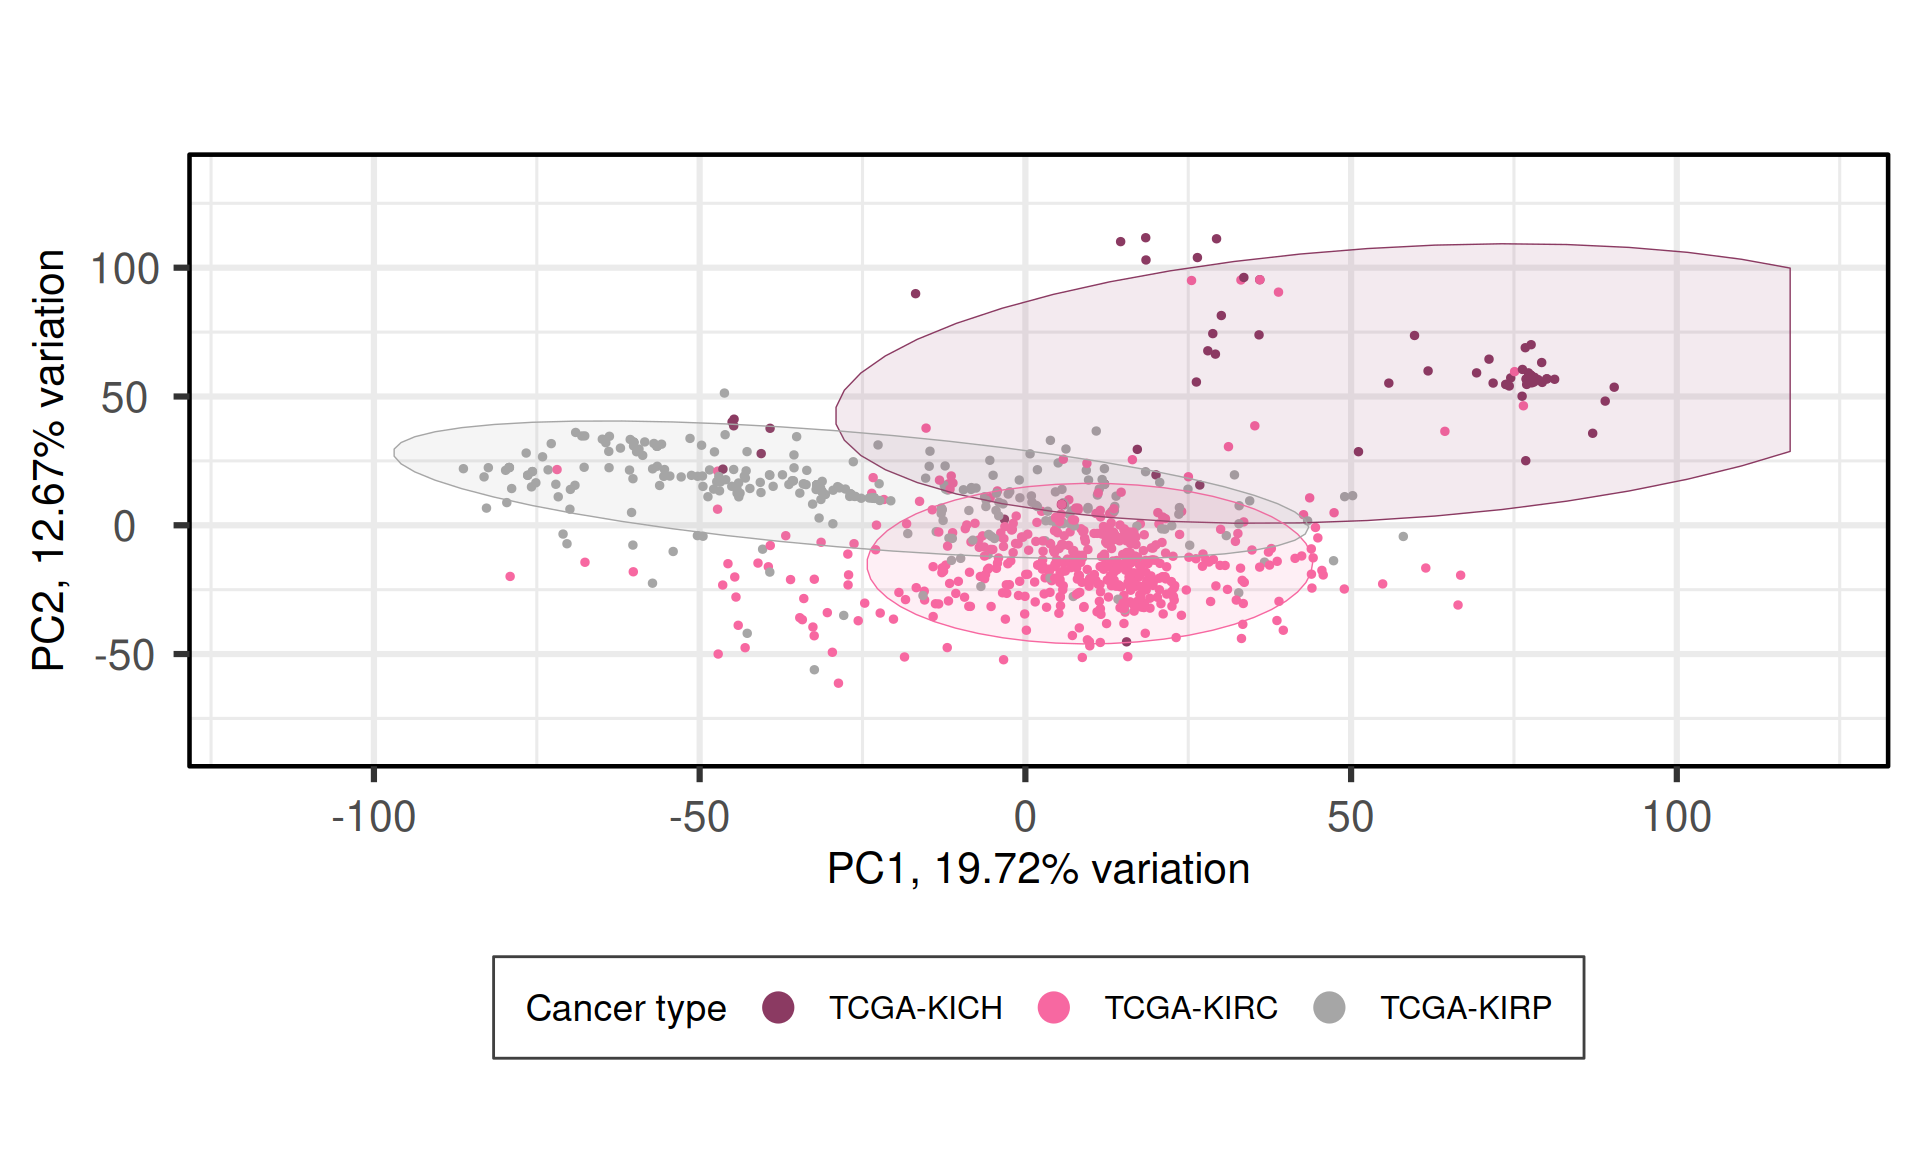
We can also investigate other dimensions Principal Components, to see if there is a component that manages to fully resove the three cancer types. PC1 PC4 seems to best separate samples from KIRC, KIRP and KICH.
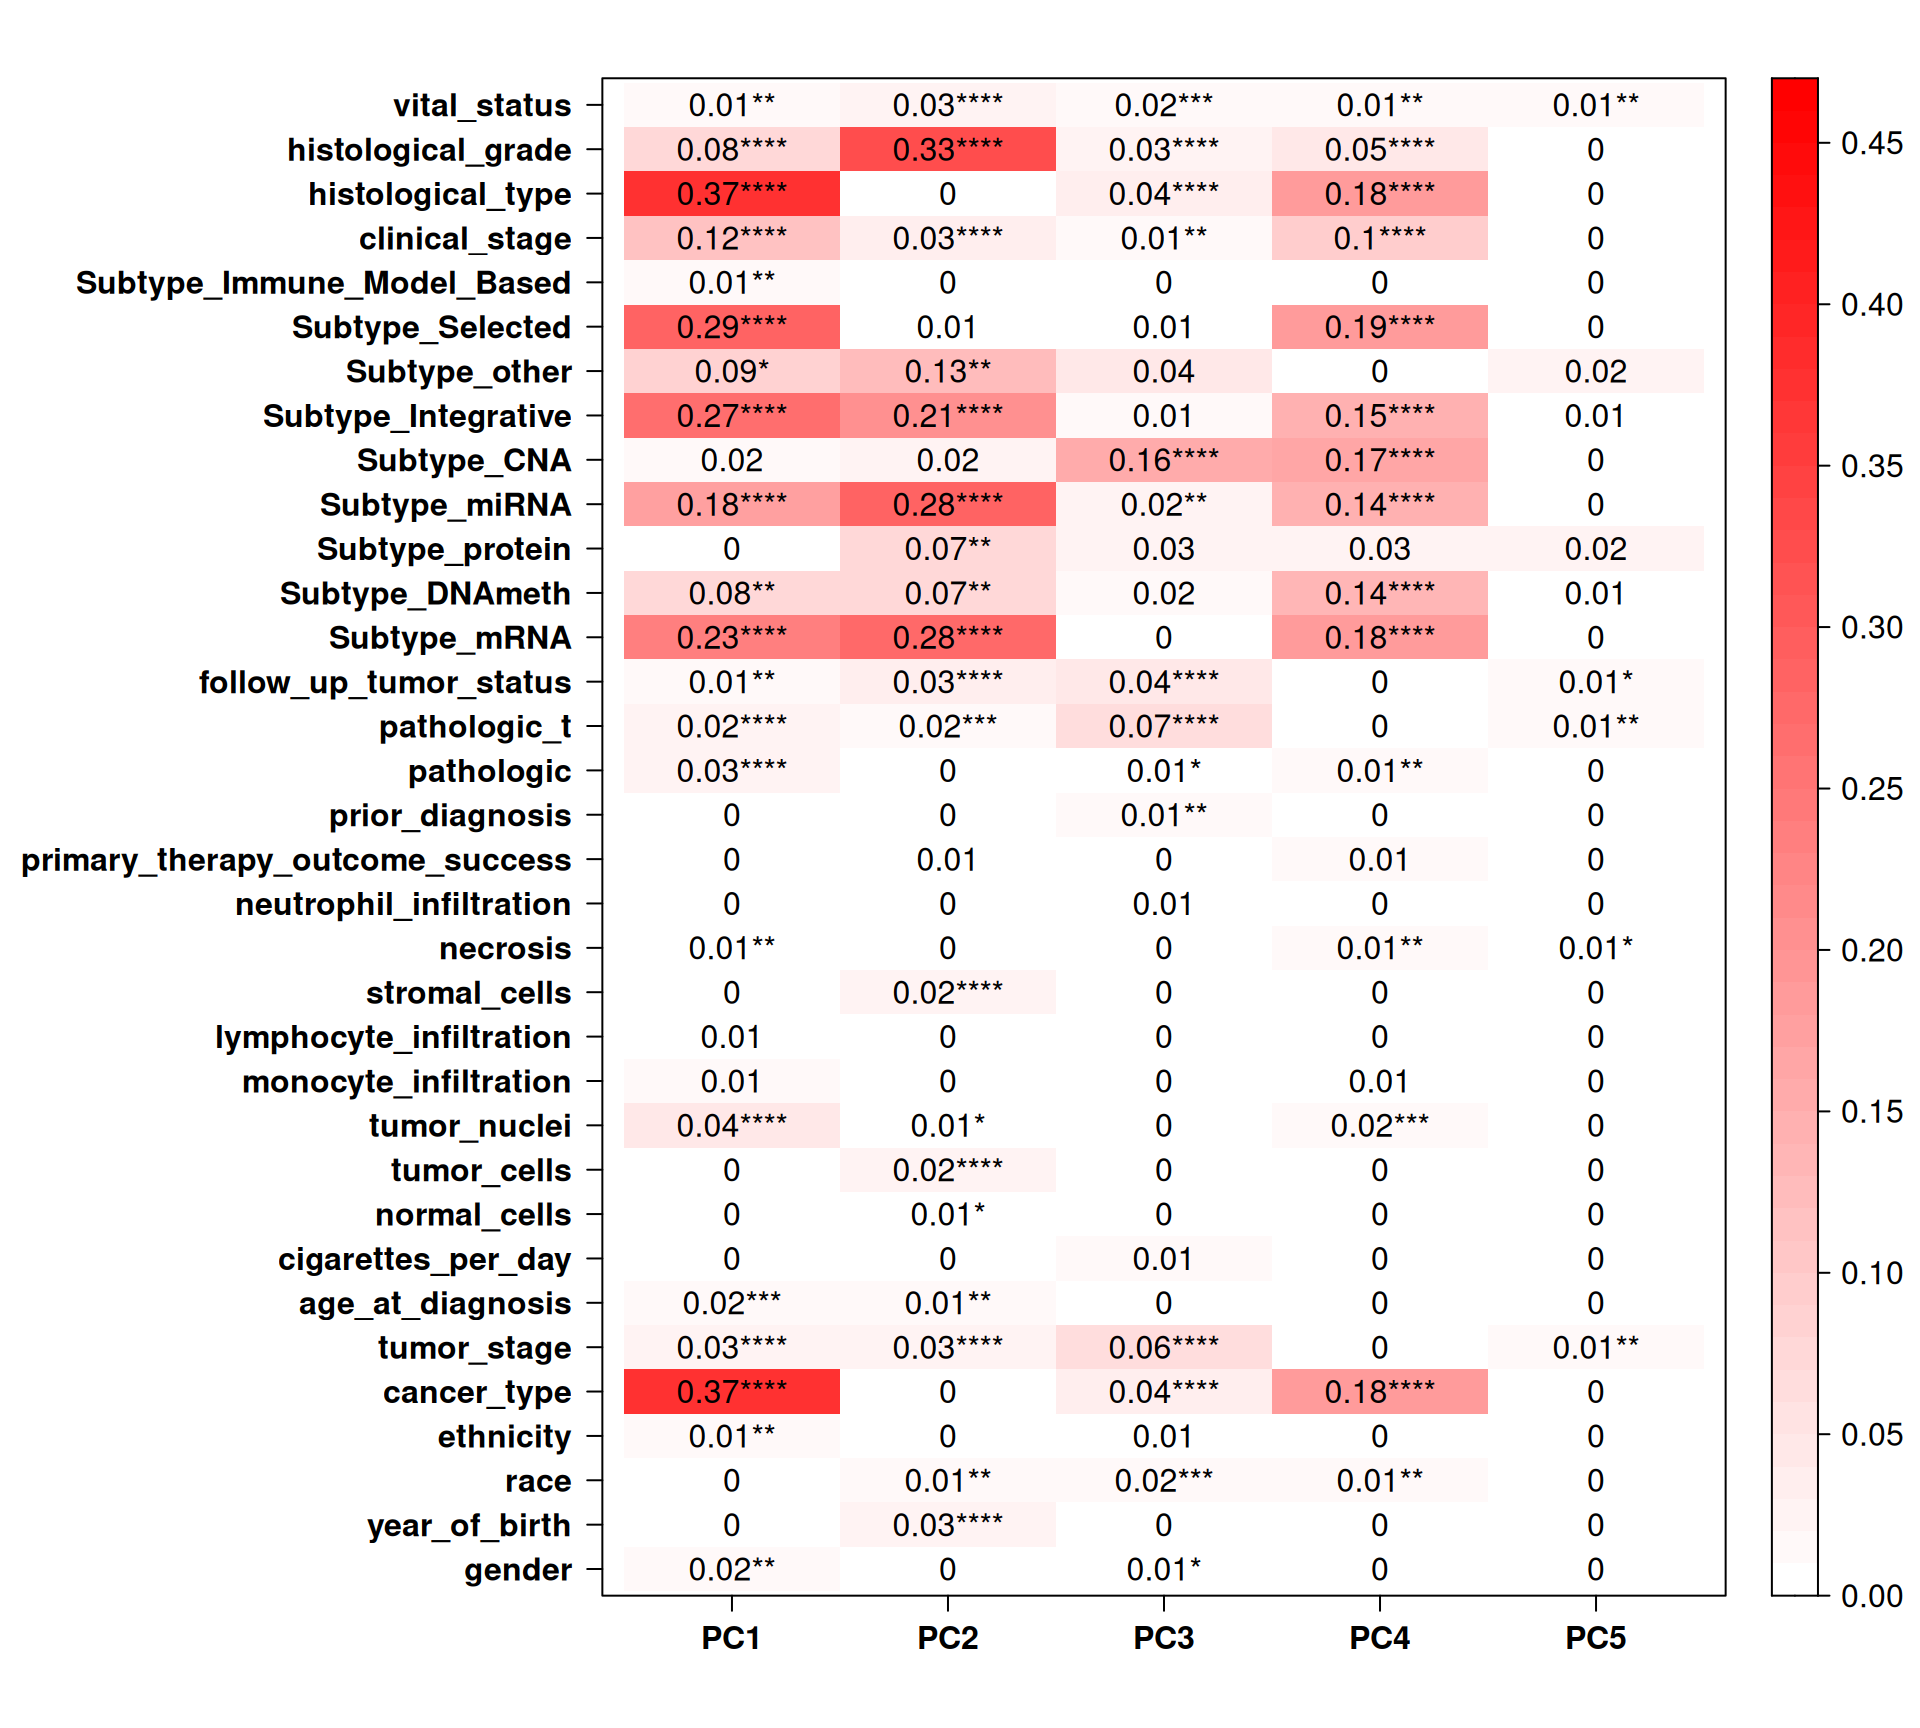
Let’s check the Pearson correlation with other clinical covariates.
Cancer_type correlates well with PC1 and PC4. Most of the TCGA-defined molecular subtypes correlates with PC1, PC2 and PC4. Interestingly, TCGA Subtype_CNA, which should be based on he CNV data, correlates with PC3 and PC4, but not PC1. PC3 is interesting since it correlates with follow_up_tumor_status, pathologic_t and tumor_stage, suggesting a link between CNVs signatures and cancer advancement, which is a common feature across all kidney carcinomas and not limited to KIRC, KIRP or KICH.
5.3 Somatic mutations
Let’s now dig into the Somatic Mutations detected in the biopsies of the kidney carcinomas patients. We have somatic information for 711 samples (~80% of the total 887 patients in the cohort). TCGA provides information on somatic mutations as binary information for each gene: 1, if the patient has a non-silent mutation for that gene, or 0, if the patient does not have a non-silent mutation on that gene. We could retrieve info for for 40,542 genes, and 13,584 of them had a non-silent mutations in at least one of our 711 kidney carcinomas patients. The first step was then to discard from downstream analysis the 26,958 that appeared not mutated in the kidney carcinomas biopsies.
Let’s now look at the distribution of somatic mutations across the different kidney carcinomas. KICH patients had an average of 31 genes with non-mutations, against the 53 and 56 average number of genes with non-silent mutations in KIRC and KIRP patients, respectively. Chromosomes 1, 2, 3, 11, 17 nad 19 where the chromosomes with more mutated genes on average.
5.3.1 Mutational signatures across Kidney cancers
Let’s now investigate the presence of any non-silent somatic mutation signature across the three kidney carcinomas.
While for KICH and KIRP patients the non-silent somatic mutations seems to be evenly distributed across the genome, KIRC patients clearly show an over-abundance of 3 preferably mutated genes, one in chromosome 2 and two in chromosome 3.
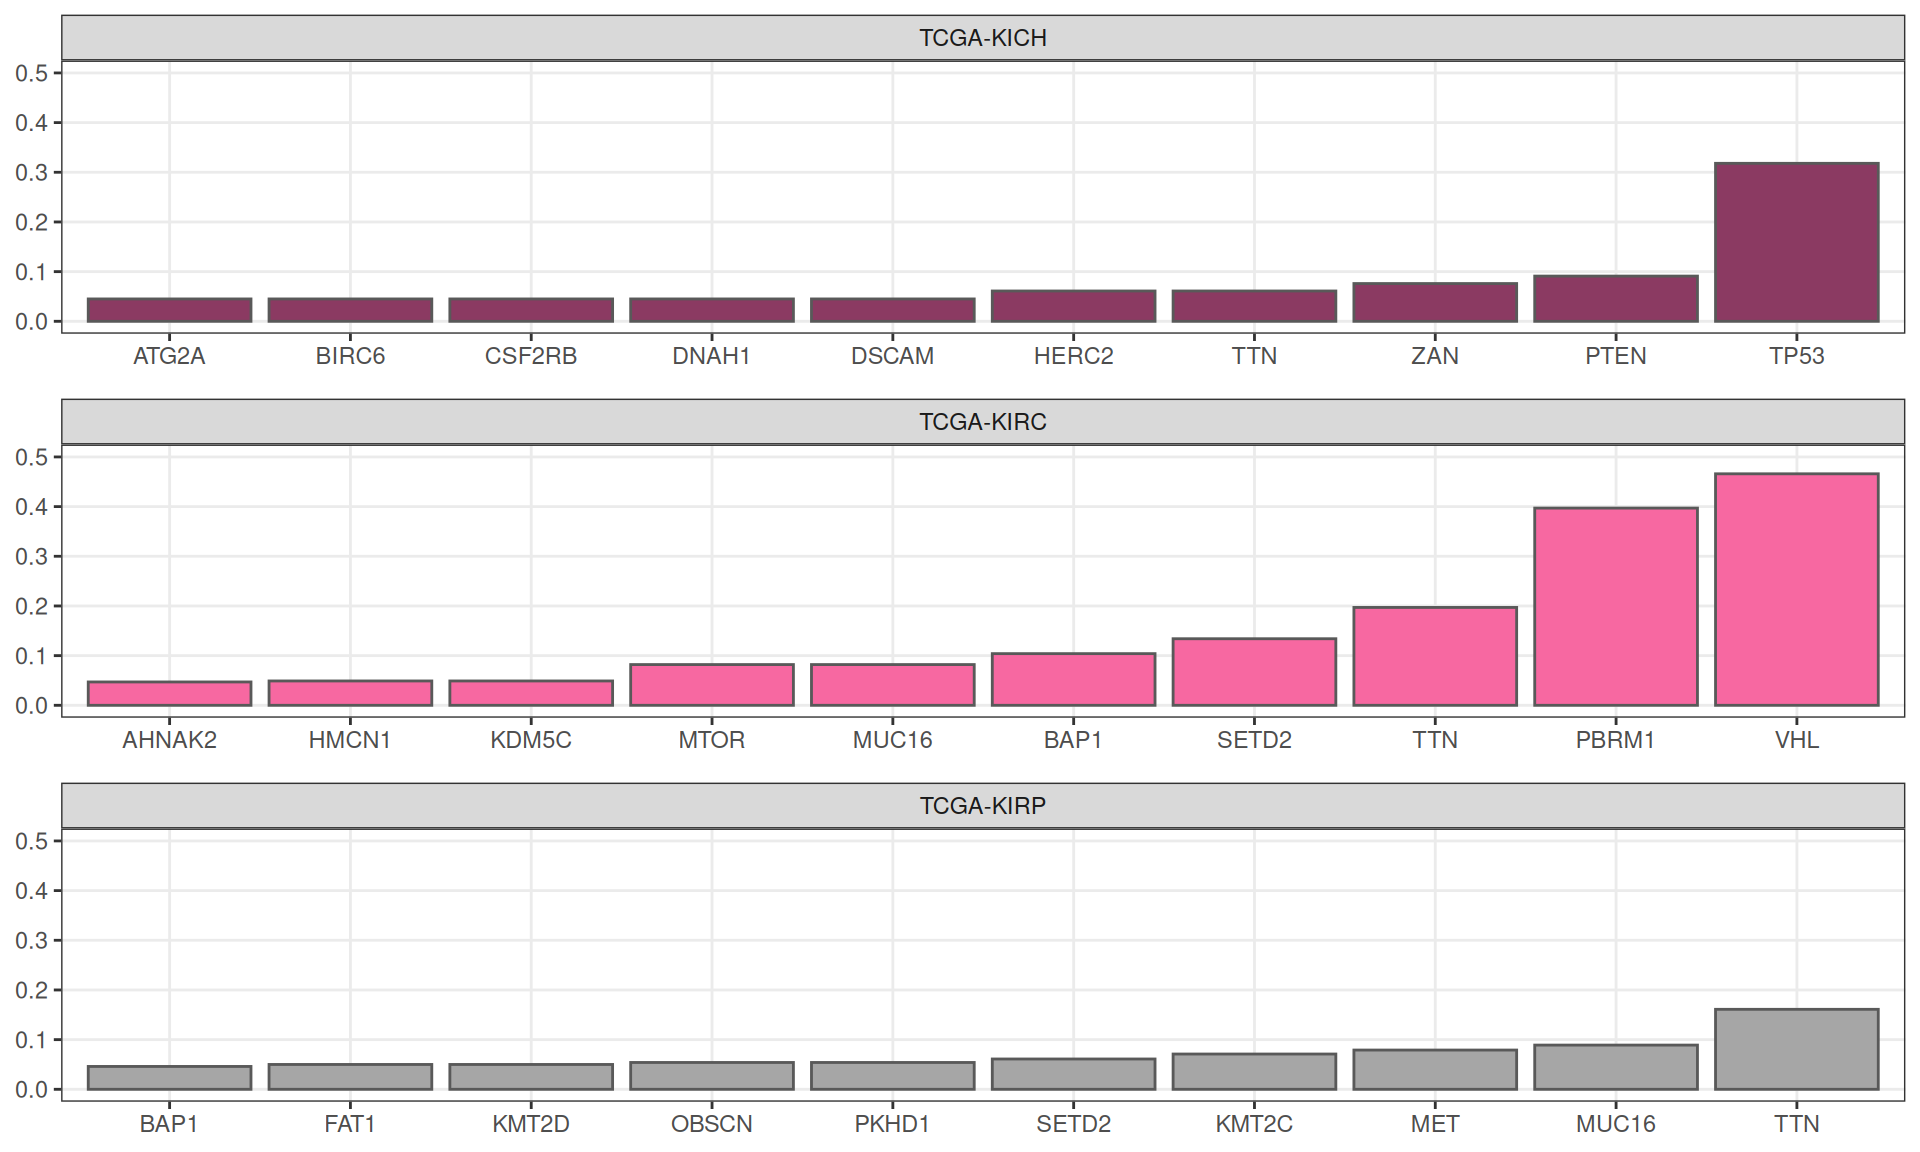
Using external_gene_name as id variablesIn KICH, ~30% of the patients (21 / 66) had a non-silent mutation in TP53, followed by 9% of patients (6 / 66) having a mutation on PTEN. As expected, KIRC patients show the highest mutational burden, with ~47% of patients (170 / 365) with mutation in VHL, ~40% of patients (145 / 365) with mutation on PBRM1 and ~20% of patients (72 / 365) with non-silent somatic mutations on TTN. As well, 16% of KIRP patients (45 / 280) has non-silent somatic mutations on TTN gene.
In the table below are reported all the 19,573 somatic mutations detected across the biopsies of the three kidney carcinomas.
5.3.2 Dimesionality Reduction and Dataset Exploration
5.3.2.1 Principal Component Analysis (PCA)
As we did for the other omics data, the next step in the dataset exploration is to perform the Principal Component Analysis.
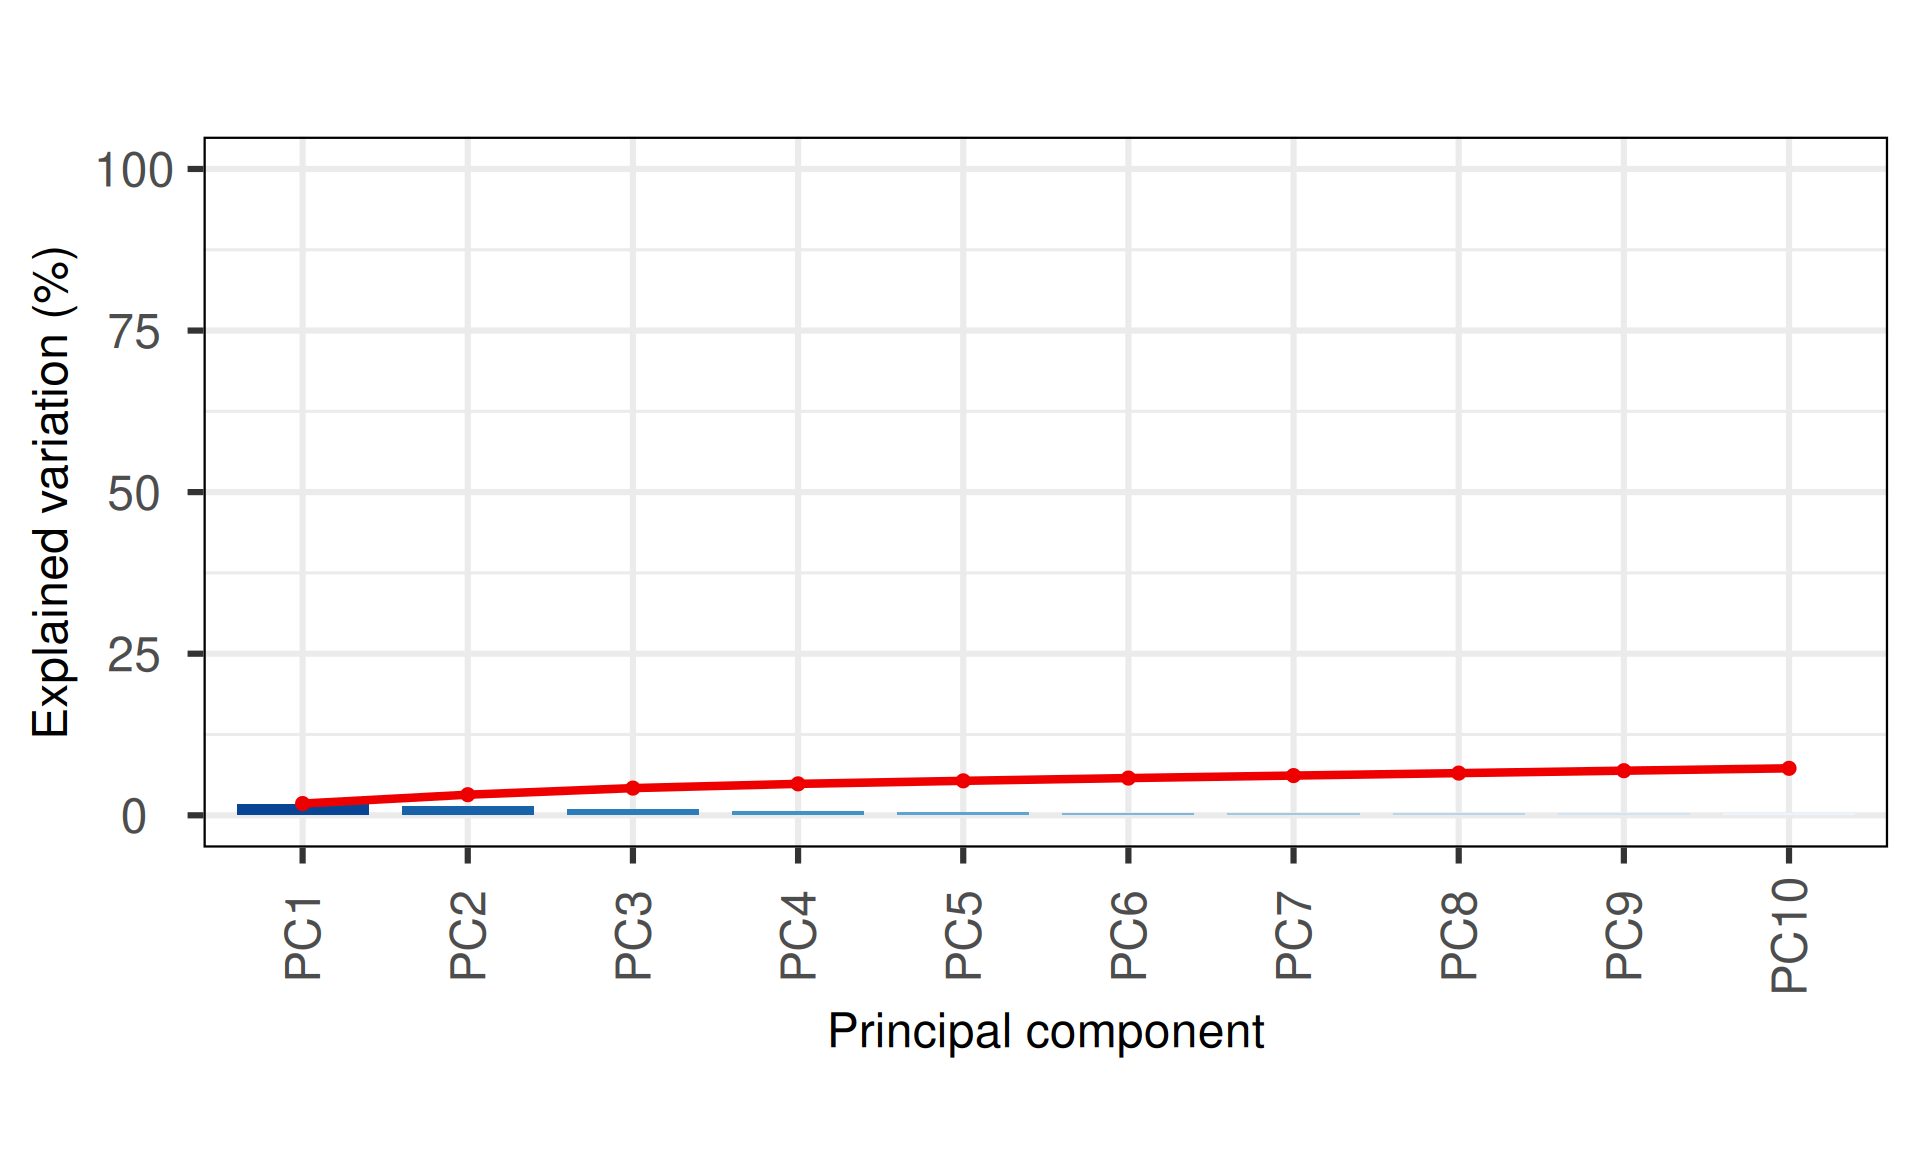
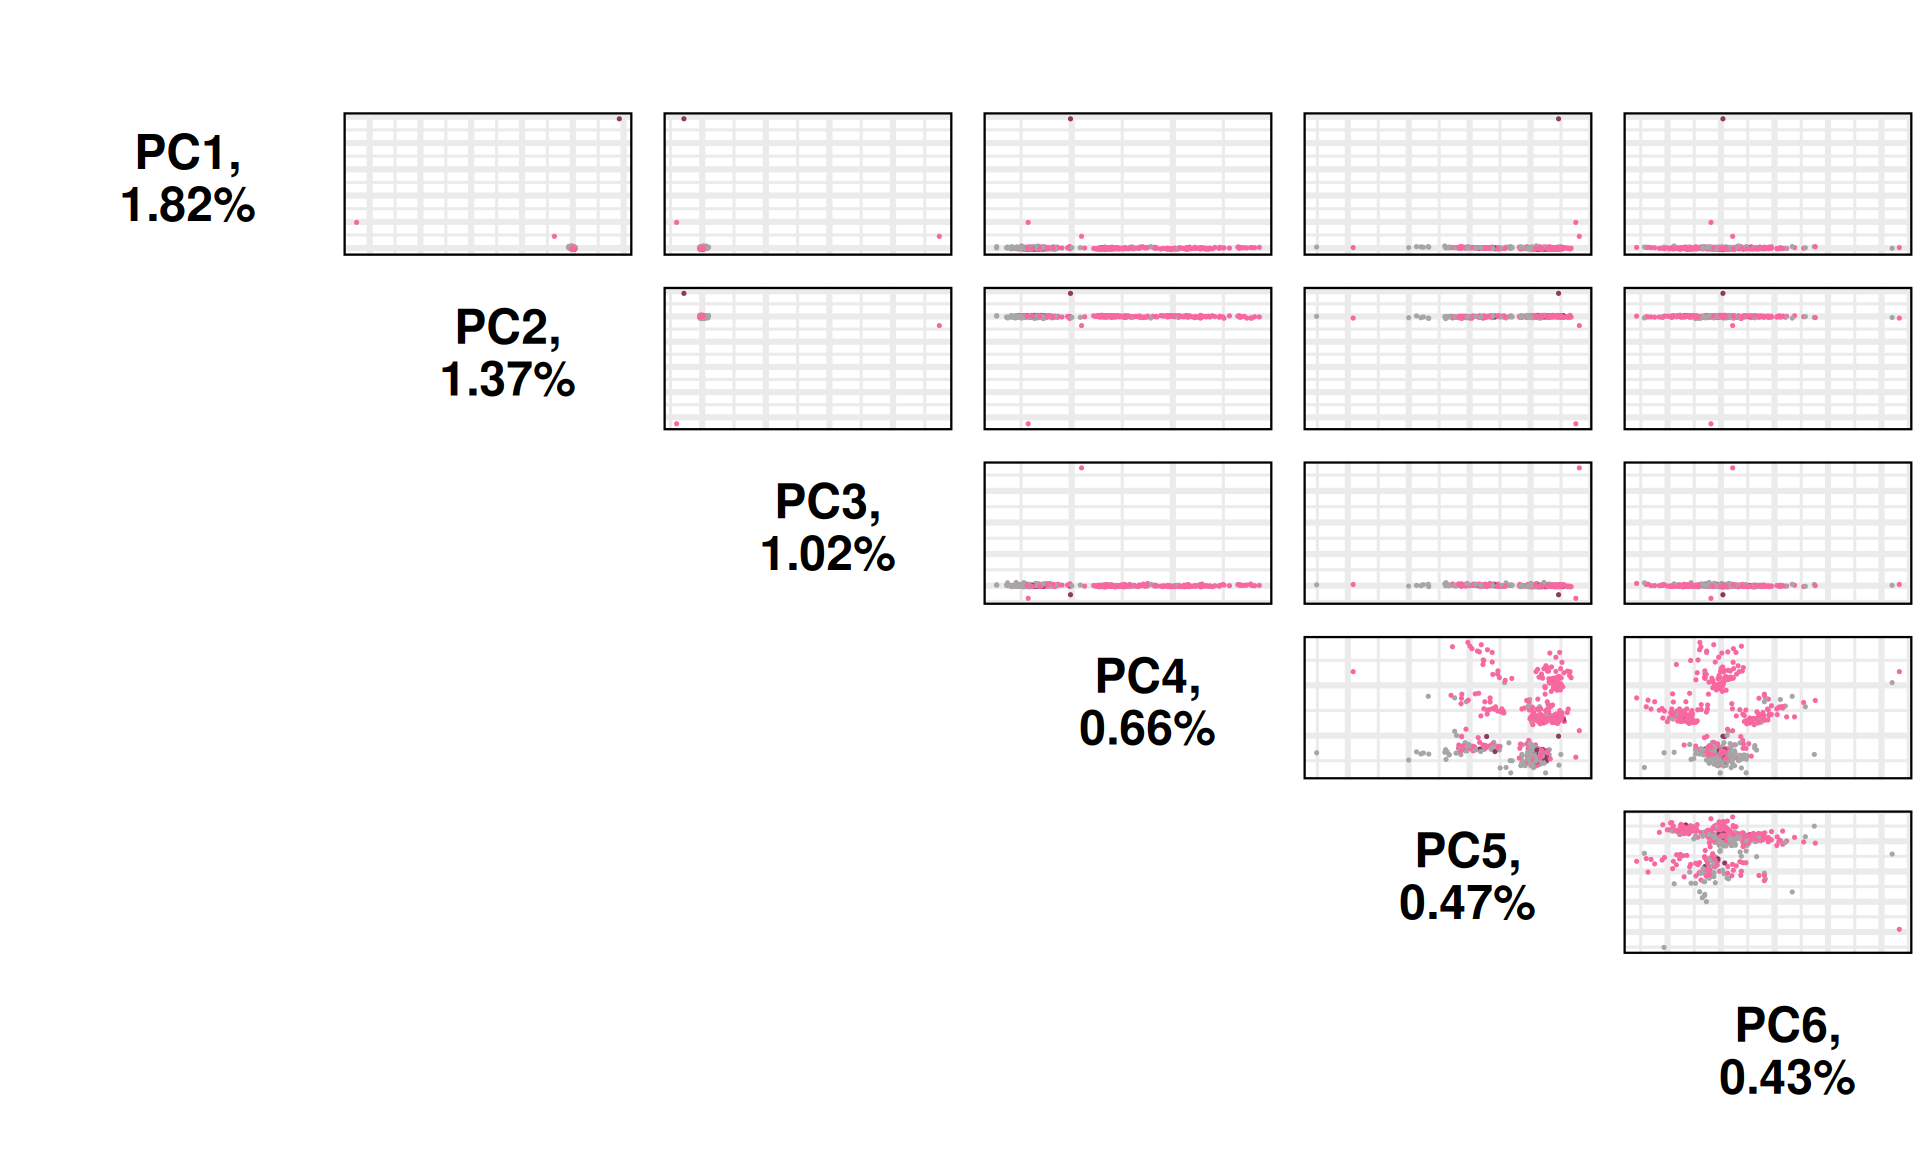
The PCA captures little to no variance observed in the non-silent somatic mutations, moreover, it fails to cluster the biopsies based on the kidney carcinoma type of origin, as seen with the UMAP. Few samples seems to be outliers driving most of the variance observed in PC1 (1.82% variance) and PC2 (1.37% variance).
PC4 and PC6 seems to separate KIRC samples into four distinct clusters, one of which overlapping with a cluster containing as well KIRP and KICH biopsies.
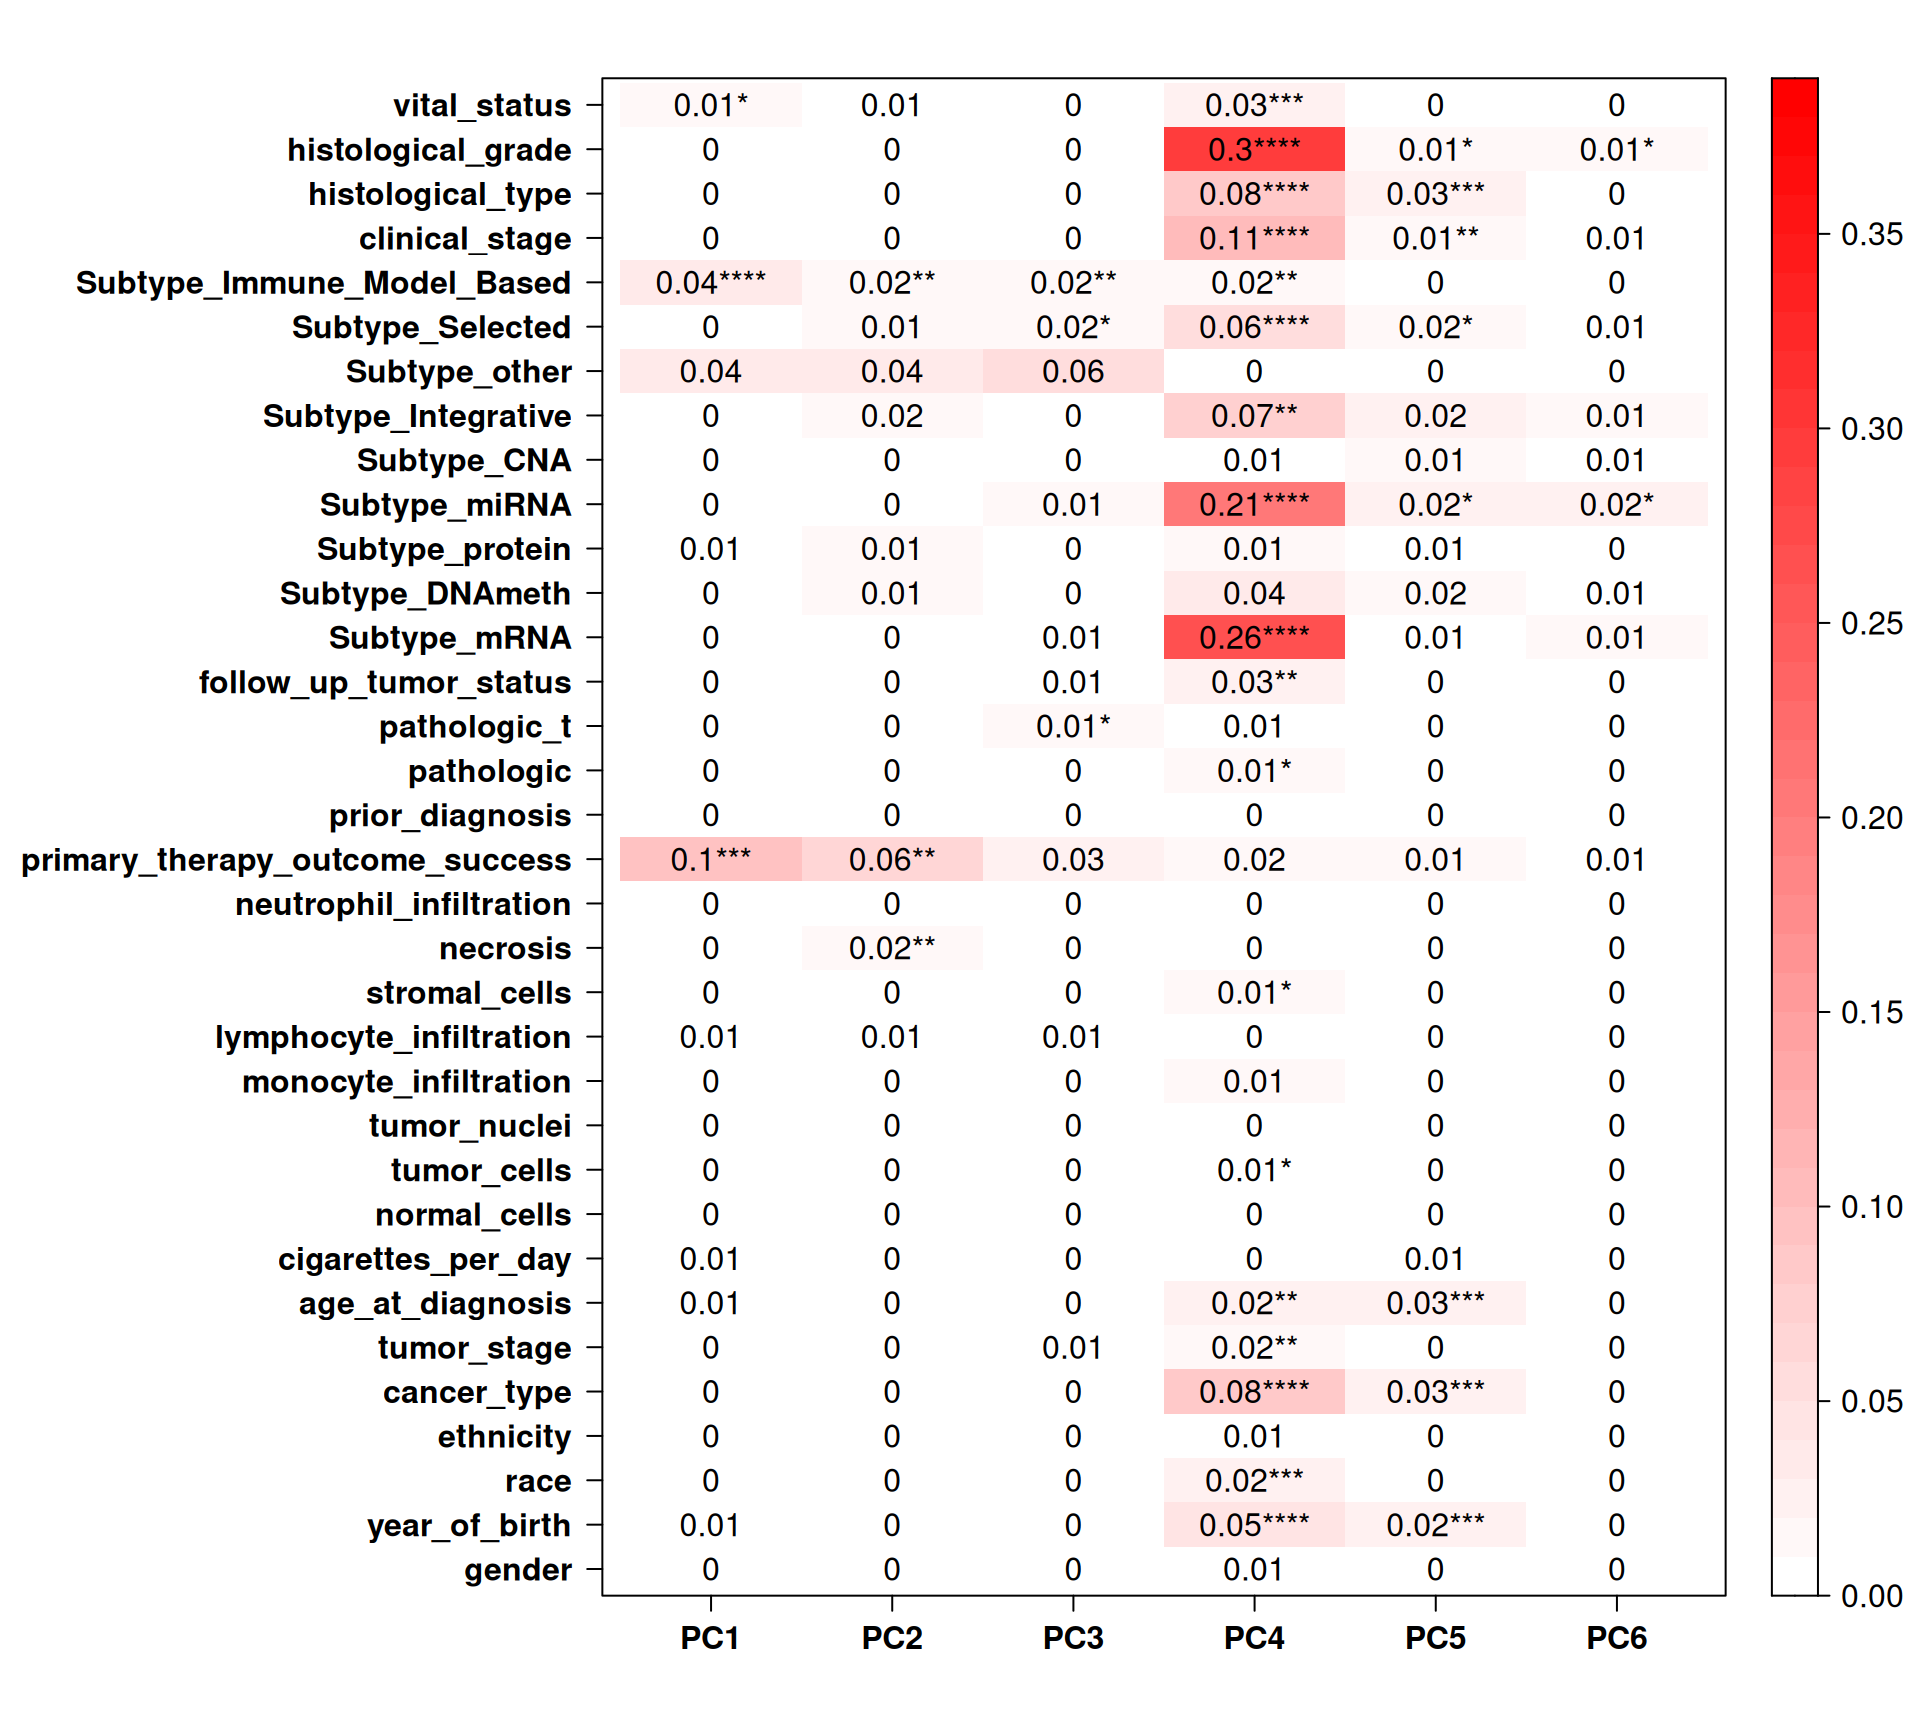
PC4 (0.66% of observed variance) seems to correlate with some clinical covariates, such as histological_grade and subtype_mRNA, but it is difficult to attach a biological relevance to this observation since we cannot properly cluster samples on the PCAs.
5.4 Epigenomics
Now, we move forward to analyse the epigenomics data, that provides information on the methylation status of the CpG islands across the genomes of the kidney carcinomas. The methylation status is captured with Illumina 450k arrays, and for each CpG island we have two measurements: a methylated intensity (M) and an unmethylated intensity (U) that allows for calculating the propostion of methilation at each CpG island.
For the TCGA epigenomics data, for each CpG island we have available the corresponding Beta value, which is calculated as:
beta = M / (M / U)Under ideal conditions, a value of zero indicates that all copies of the CpG site in the sample were completely unmethylated (no methylated molecules were measured) and a value of one indicates that every copy of the site was methylated.
5.4.1 Filtering & QC
We have methylation information for 646 out of the 887 kidney carcinoma biopsies: 65 KICH, 311 KIRC and 270 KIRP patients, respectively. TCGA provides methylation status as beta values for 148,068 whitelisted probes. Out of them, 6,364 probes consistently have missing values across the 646 samples, so after filtering them out we obtain 141,704 probes.
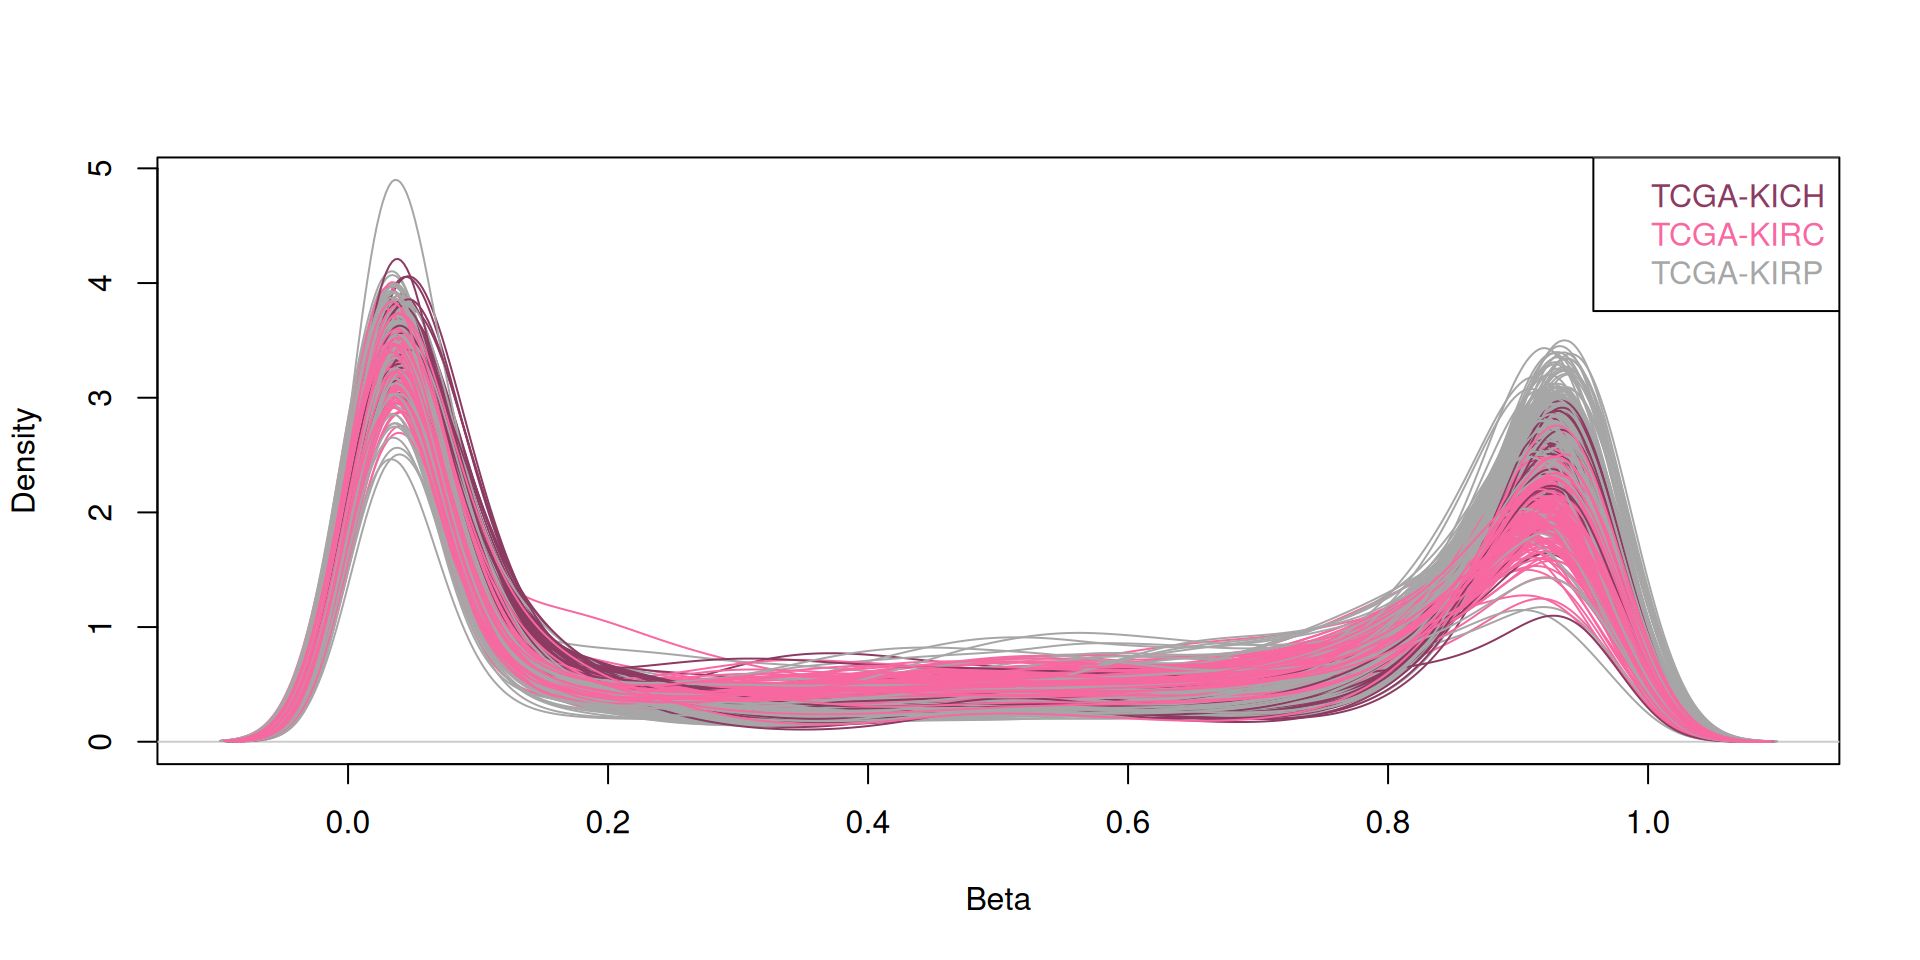
Plotting the beta-values distribution for the probes of each biopsies reveals their bimodal distribution, indicating that for each sample, the probes can either be unmethylated (beta value = 0) or methylated (beta value = 1).
5.4.2 Dimesionality Reduction and Dataset Exploration
5.4.2.1 Principal Component Analysis (PCA)
The next step in the dataset exploration is to perform the Principal Component Analysis.
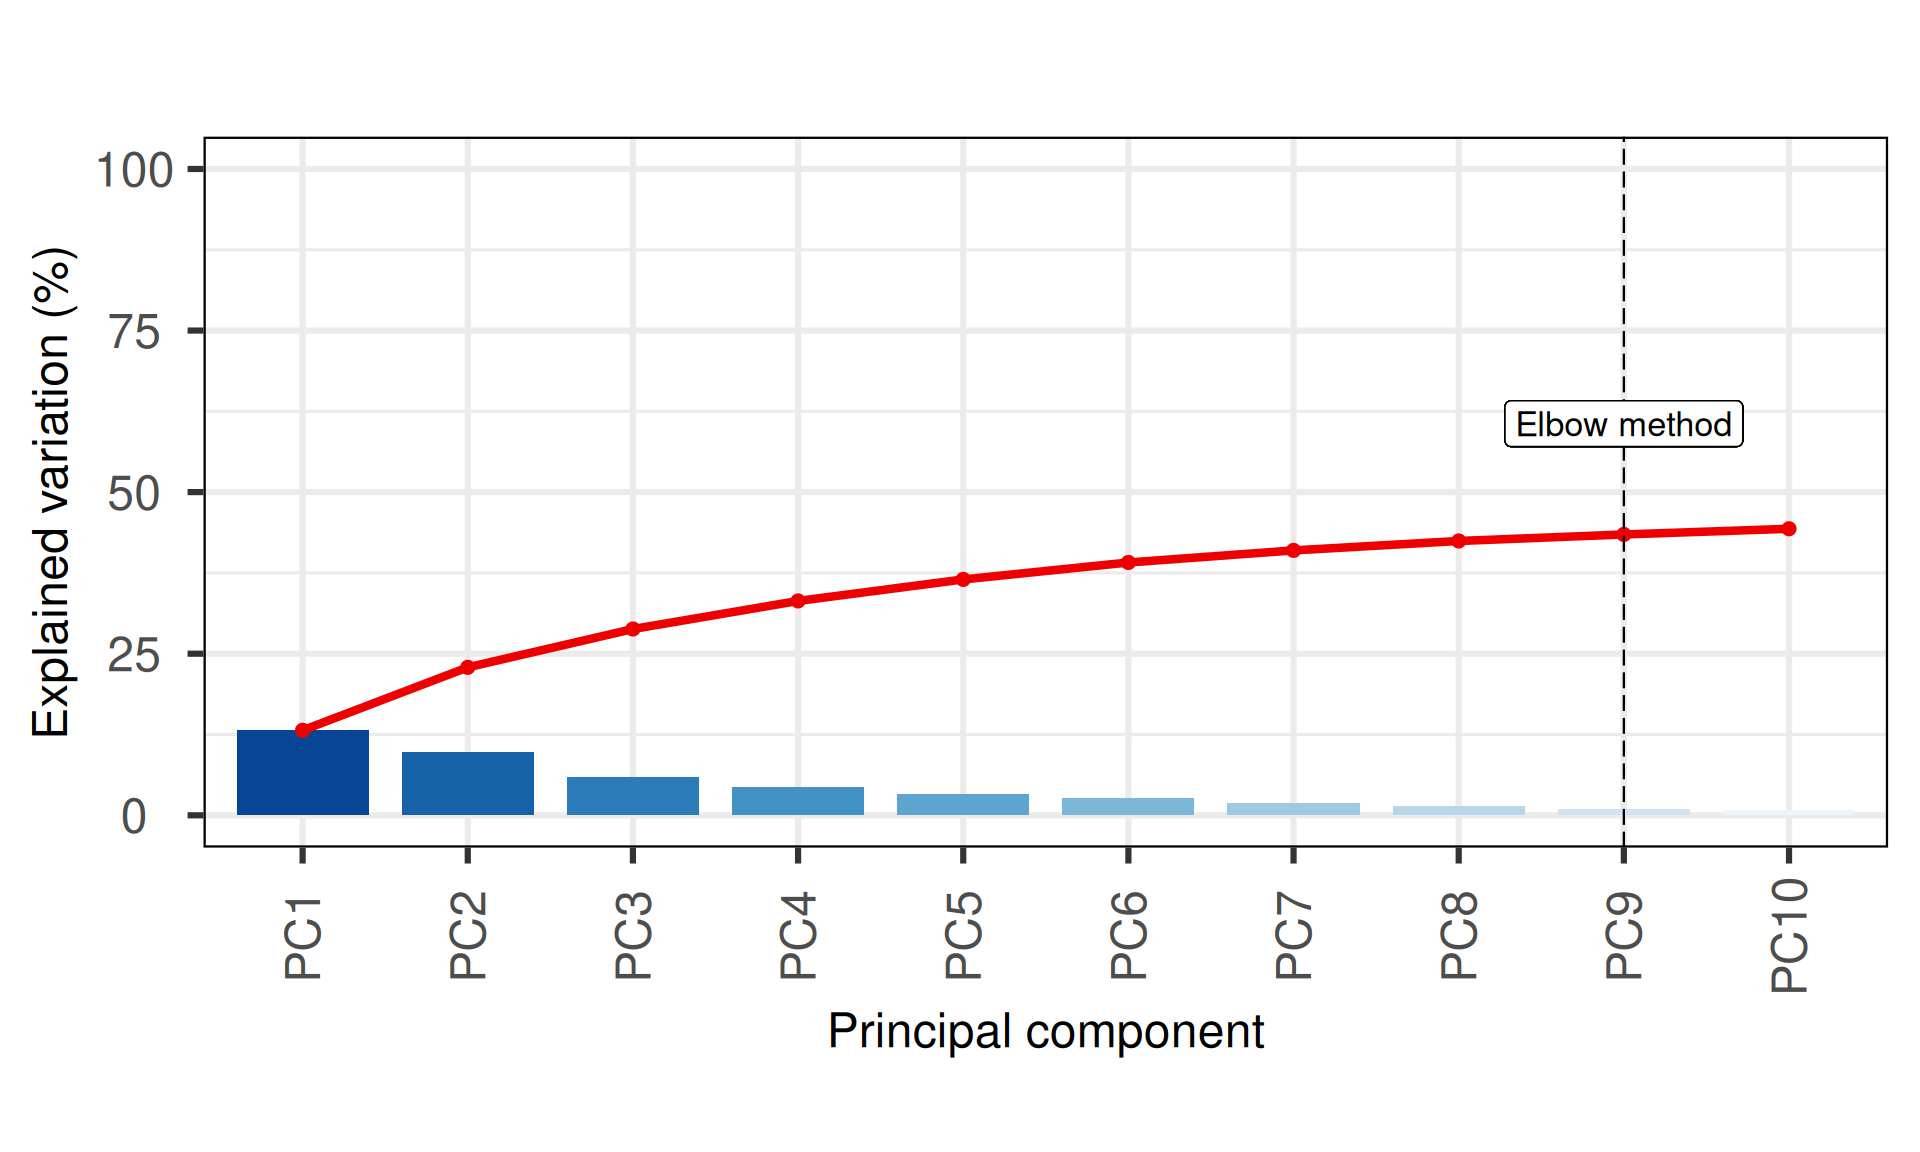
The first 10 Principal Components capture less than 50% of the variance in the Kidney cancers epigenomics dataset, with the first two components (PC1 and PC2) capturing a bit more than 20% of the variance. The screeplot, however, shows a more reasonable amount of variance capture in the top Principal Components, in contrasts to what seen using non-silent somatic mutations (see Section 5.3.2.1).
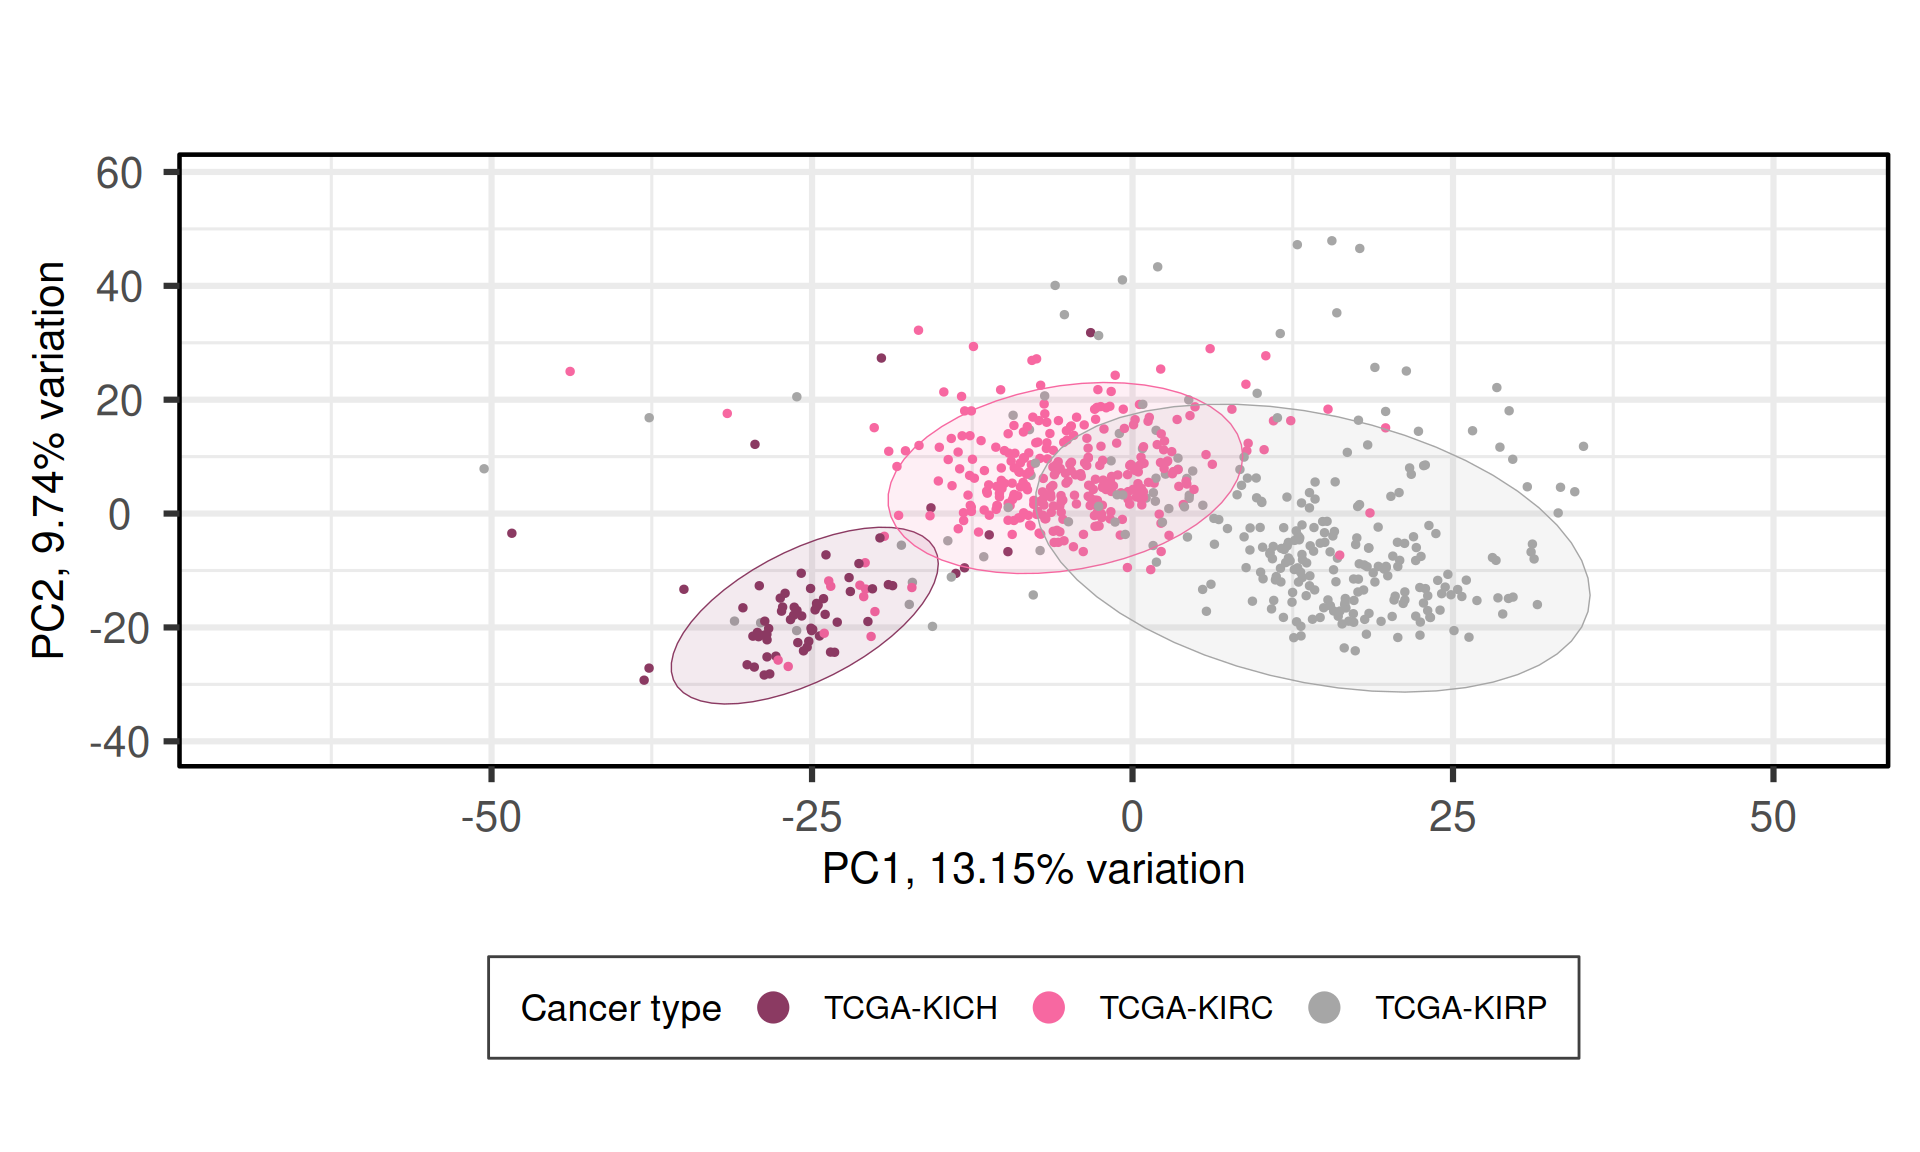
When we project the samples in the PC1 and PC2, we can see that the PC1 (~13% of observed variance) creates a gradient of samples that separates KICH, KIRC and KIRP. The second component PC2 (~10% of variance), instead, does not separates the samples based on their kidney carcinoma types.
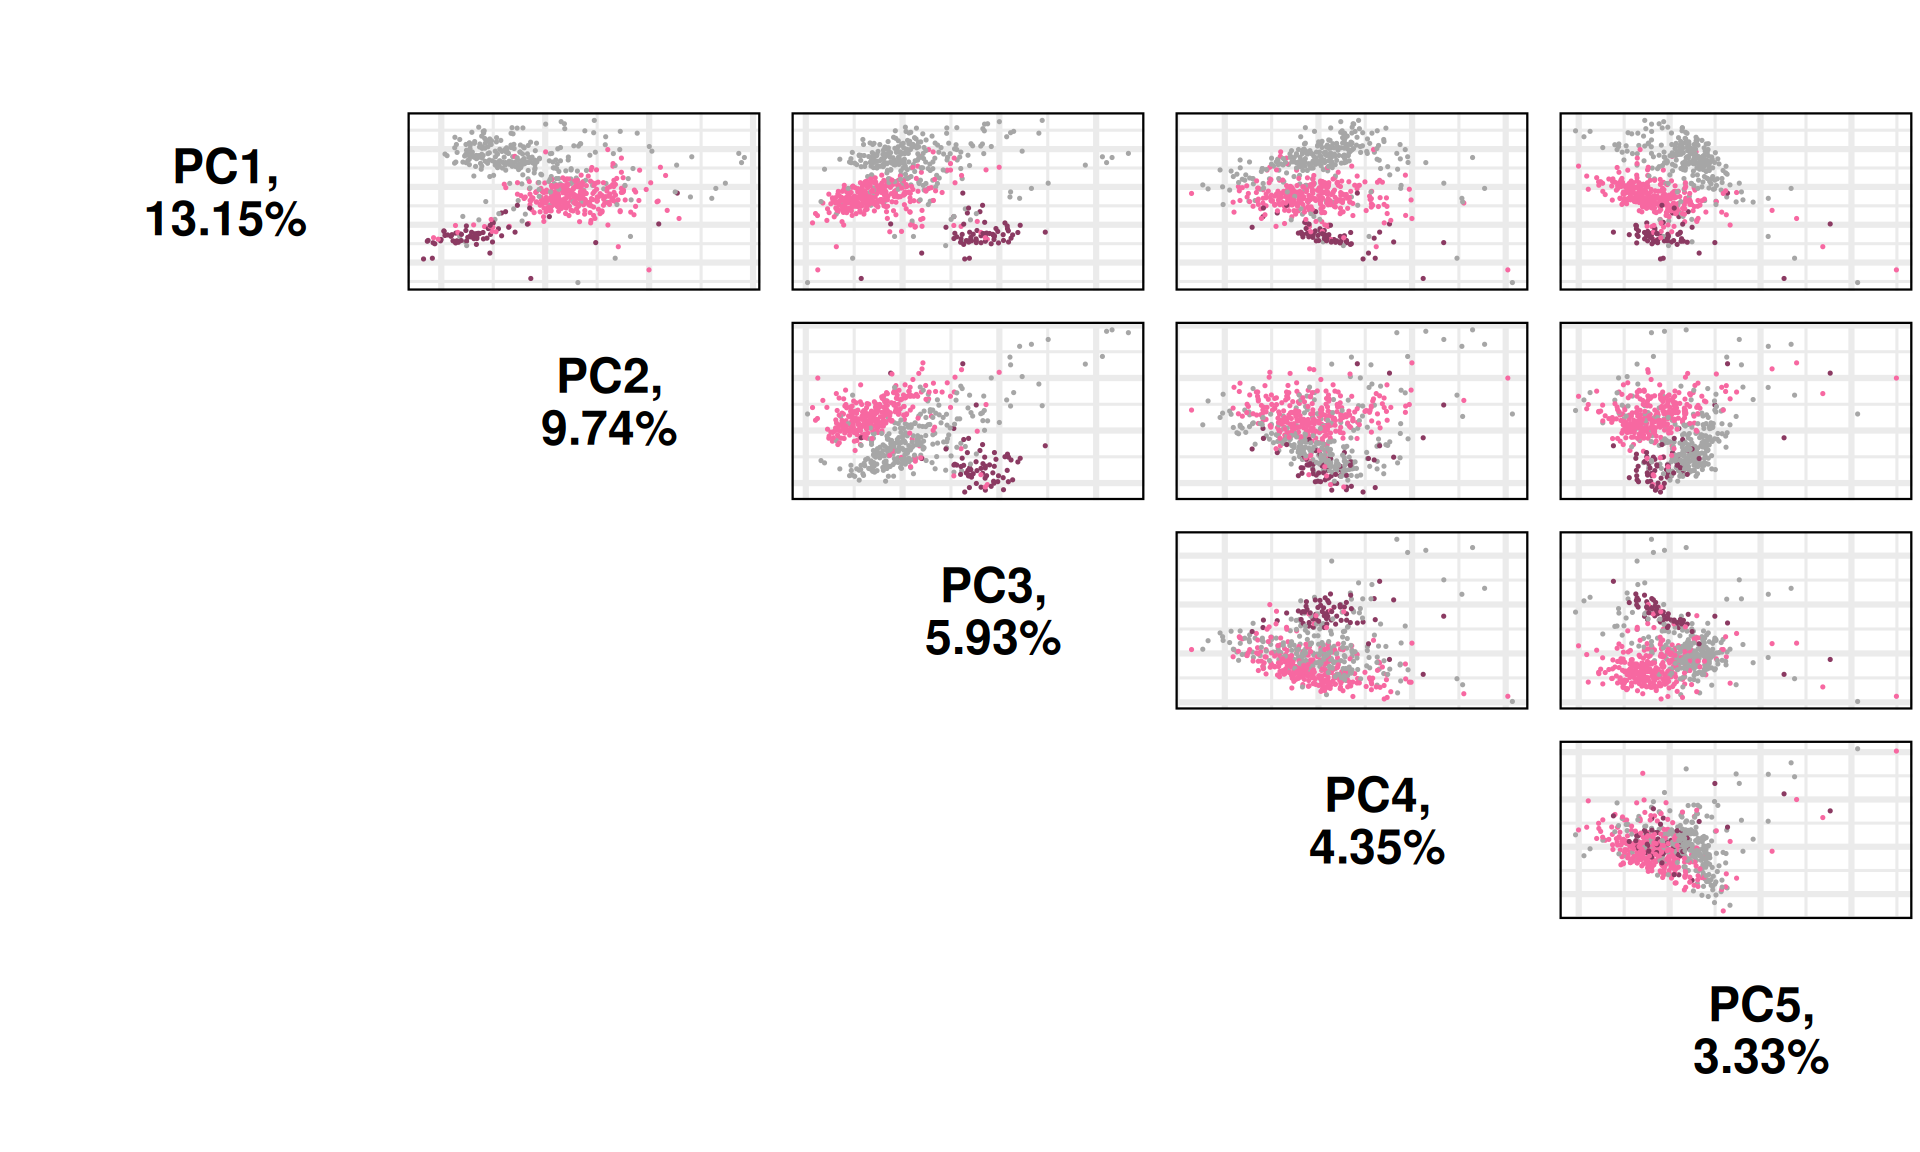
We can also investigate other dimensions Principal Components, to see if there is a component that manages to fully resolve the three cancer types. PC1xPC4 and PC1xPC5 indeed seem to separates better the three kidney carcinoma types.
Let’s check the loadings for the top 5 Principal Components. These indicate which probes are the more responsible to explain the position of the samples along the components, and the direction of this separation.
Looking at the top 1% most variable probes, the following 11 probes are the top loadings for the first 5 Principal Components:
- cg03830585
- cg07037412
- cg07159758
- cg08135406
- cg05098566
- cg07635227
- cg00868875
- cg07124687
- cg01916088
- cg03893663
- cg00204802
- cg01233786
- cg00806644
Let’s now check their beta values distributions of the five top genes identified with the PCA across the cancer types:
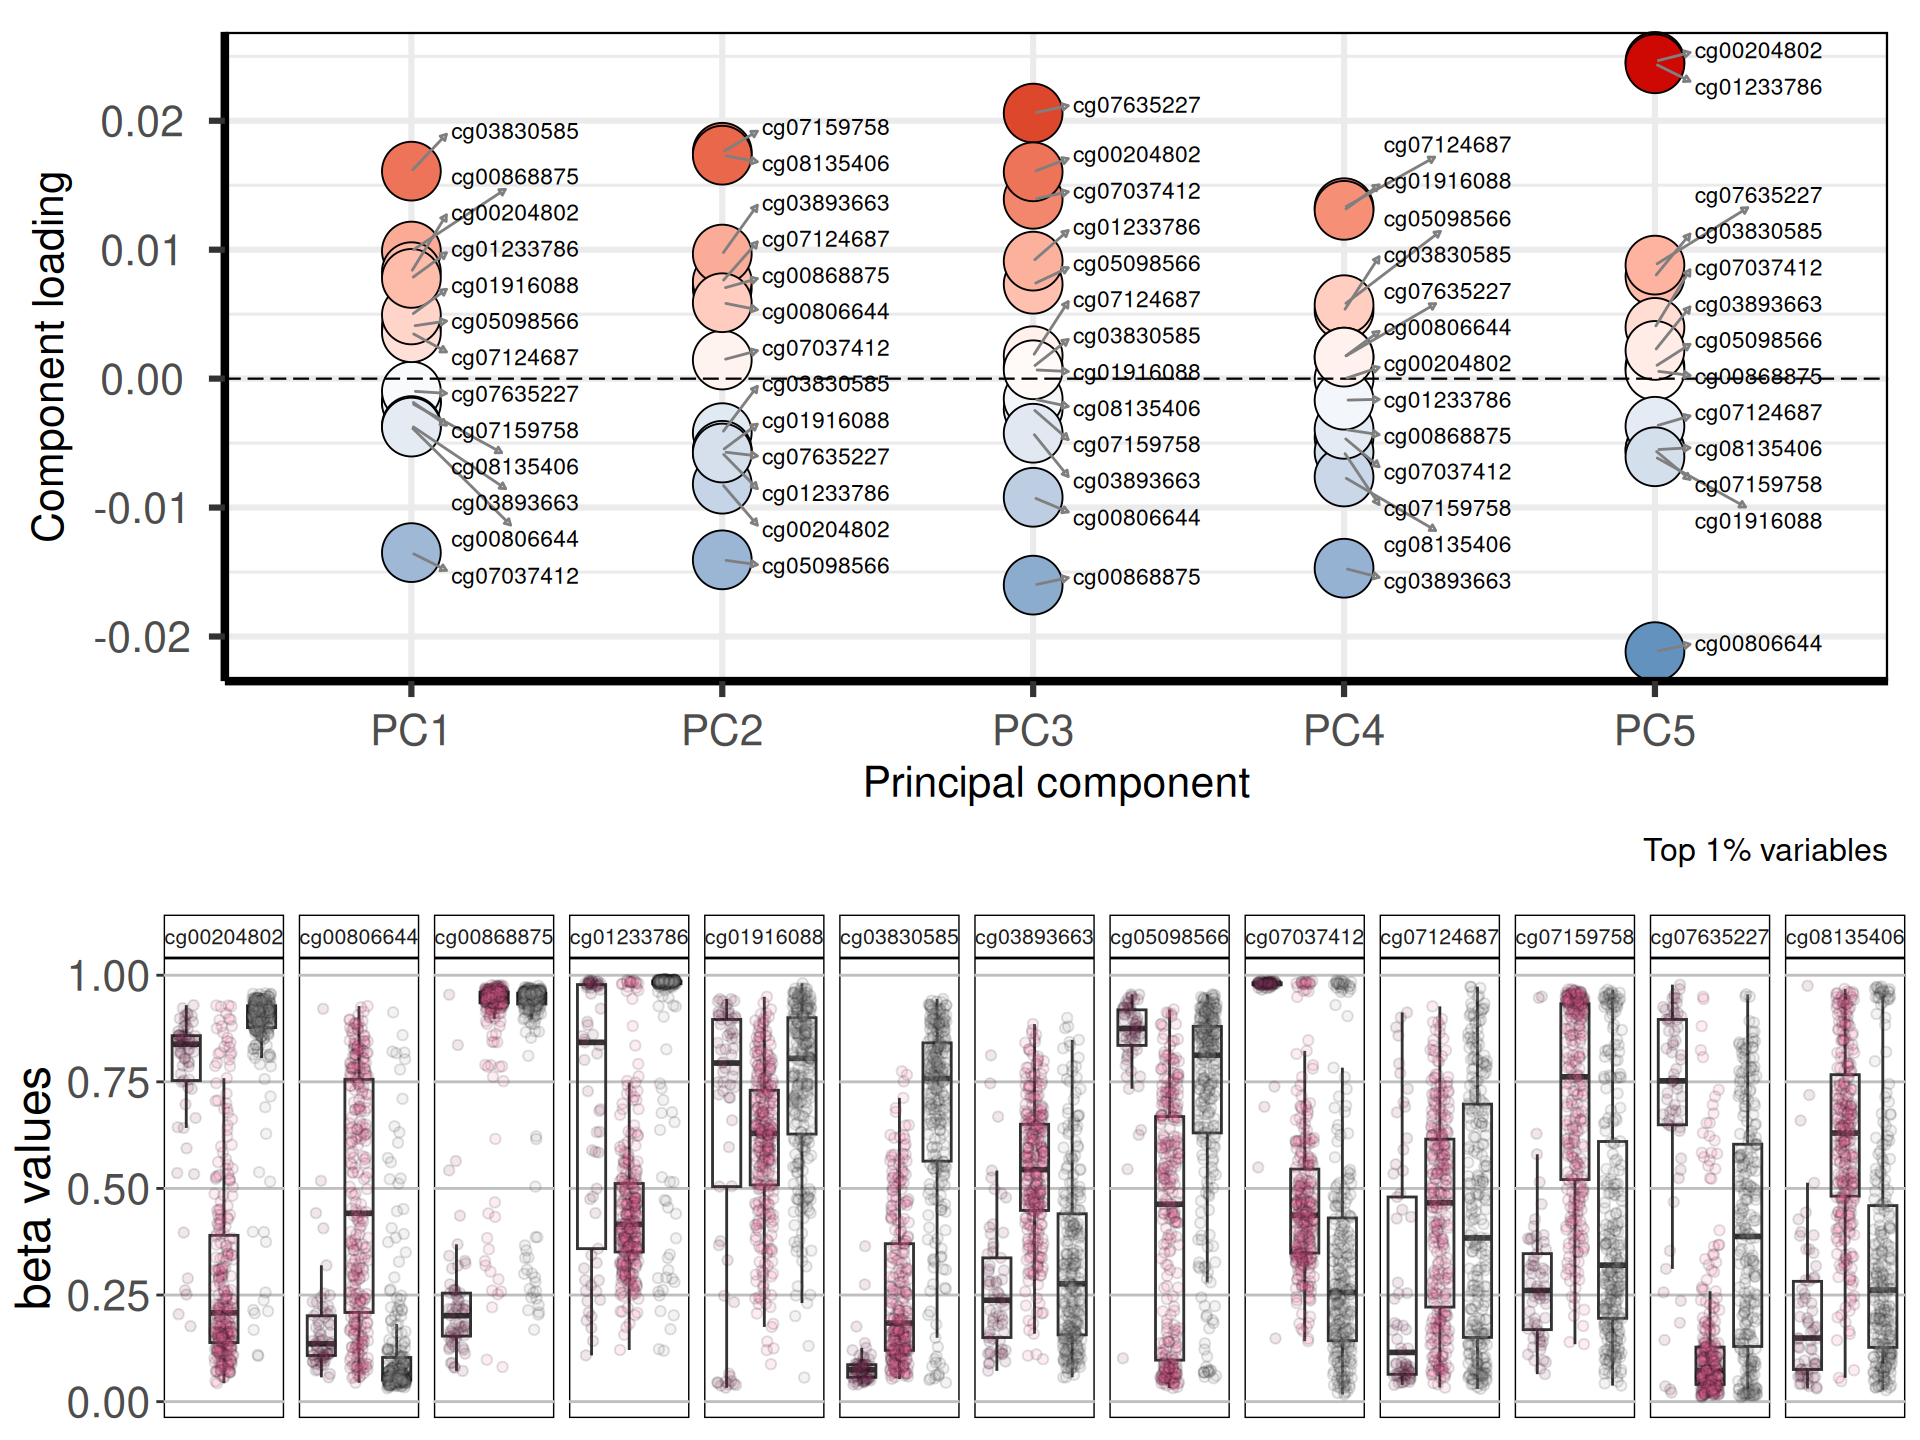
cg03830585 is associated with the Inositol 1,4,5-Trisphosphate Receptor, Type 1 ITPR1. ITPR1 is a novel target of novel target of HIF2α and protects renal cancer cells against natural killer cells by inducing autophagy. cg03830585 appears hypermethylated in KIRP, but not in KICH (cold tumor) and KIRC (hot tumor, with immuno-suppressant and immuni-evasive profile). cg00868875 is linked to the Potassium Channel Tetramerization Domain Containing 1 KCTD1, which is a prognostic marker for KIRP. Finally, cg07037412 is linked to the Calcium Voltage-Gated Channel Subunit Alpha1 H CACNA1H. Lower methylation status in KIRC and KIRP is congruent with the observation that CACNA1H was specifically overexpressed relative to normal tissue samples in renal cancer, sarcoma and gastrointestinal stromal tumors.
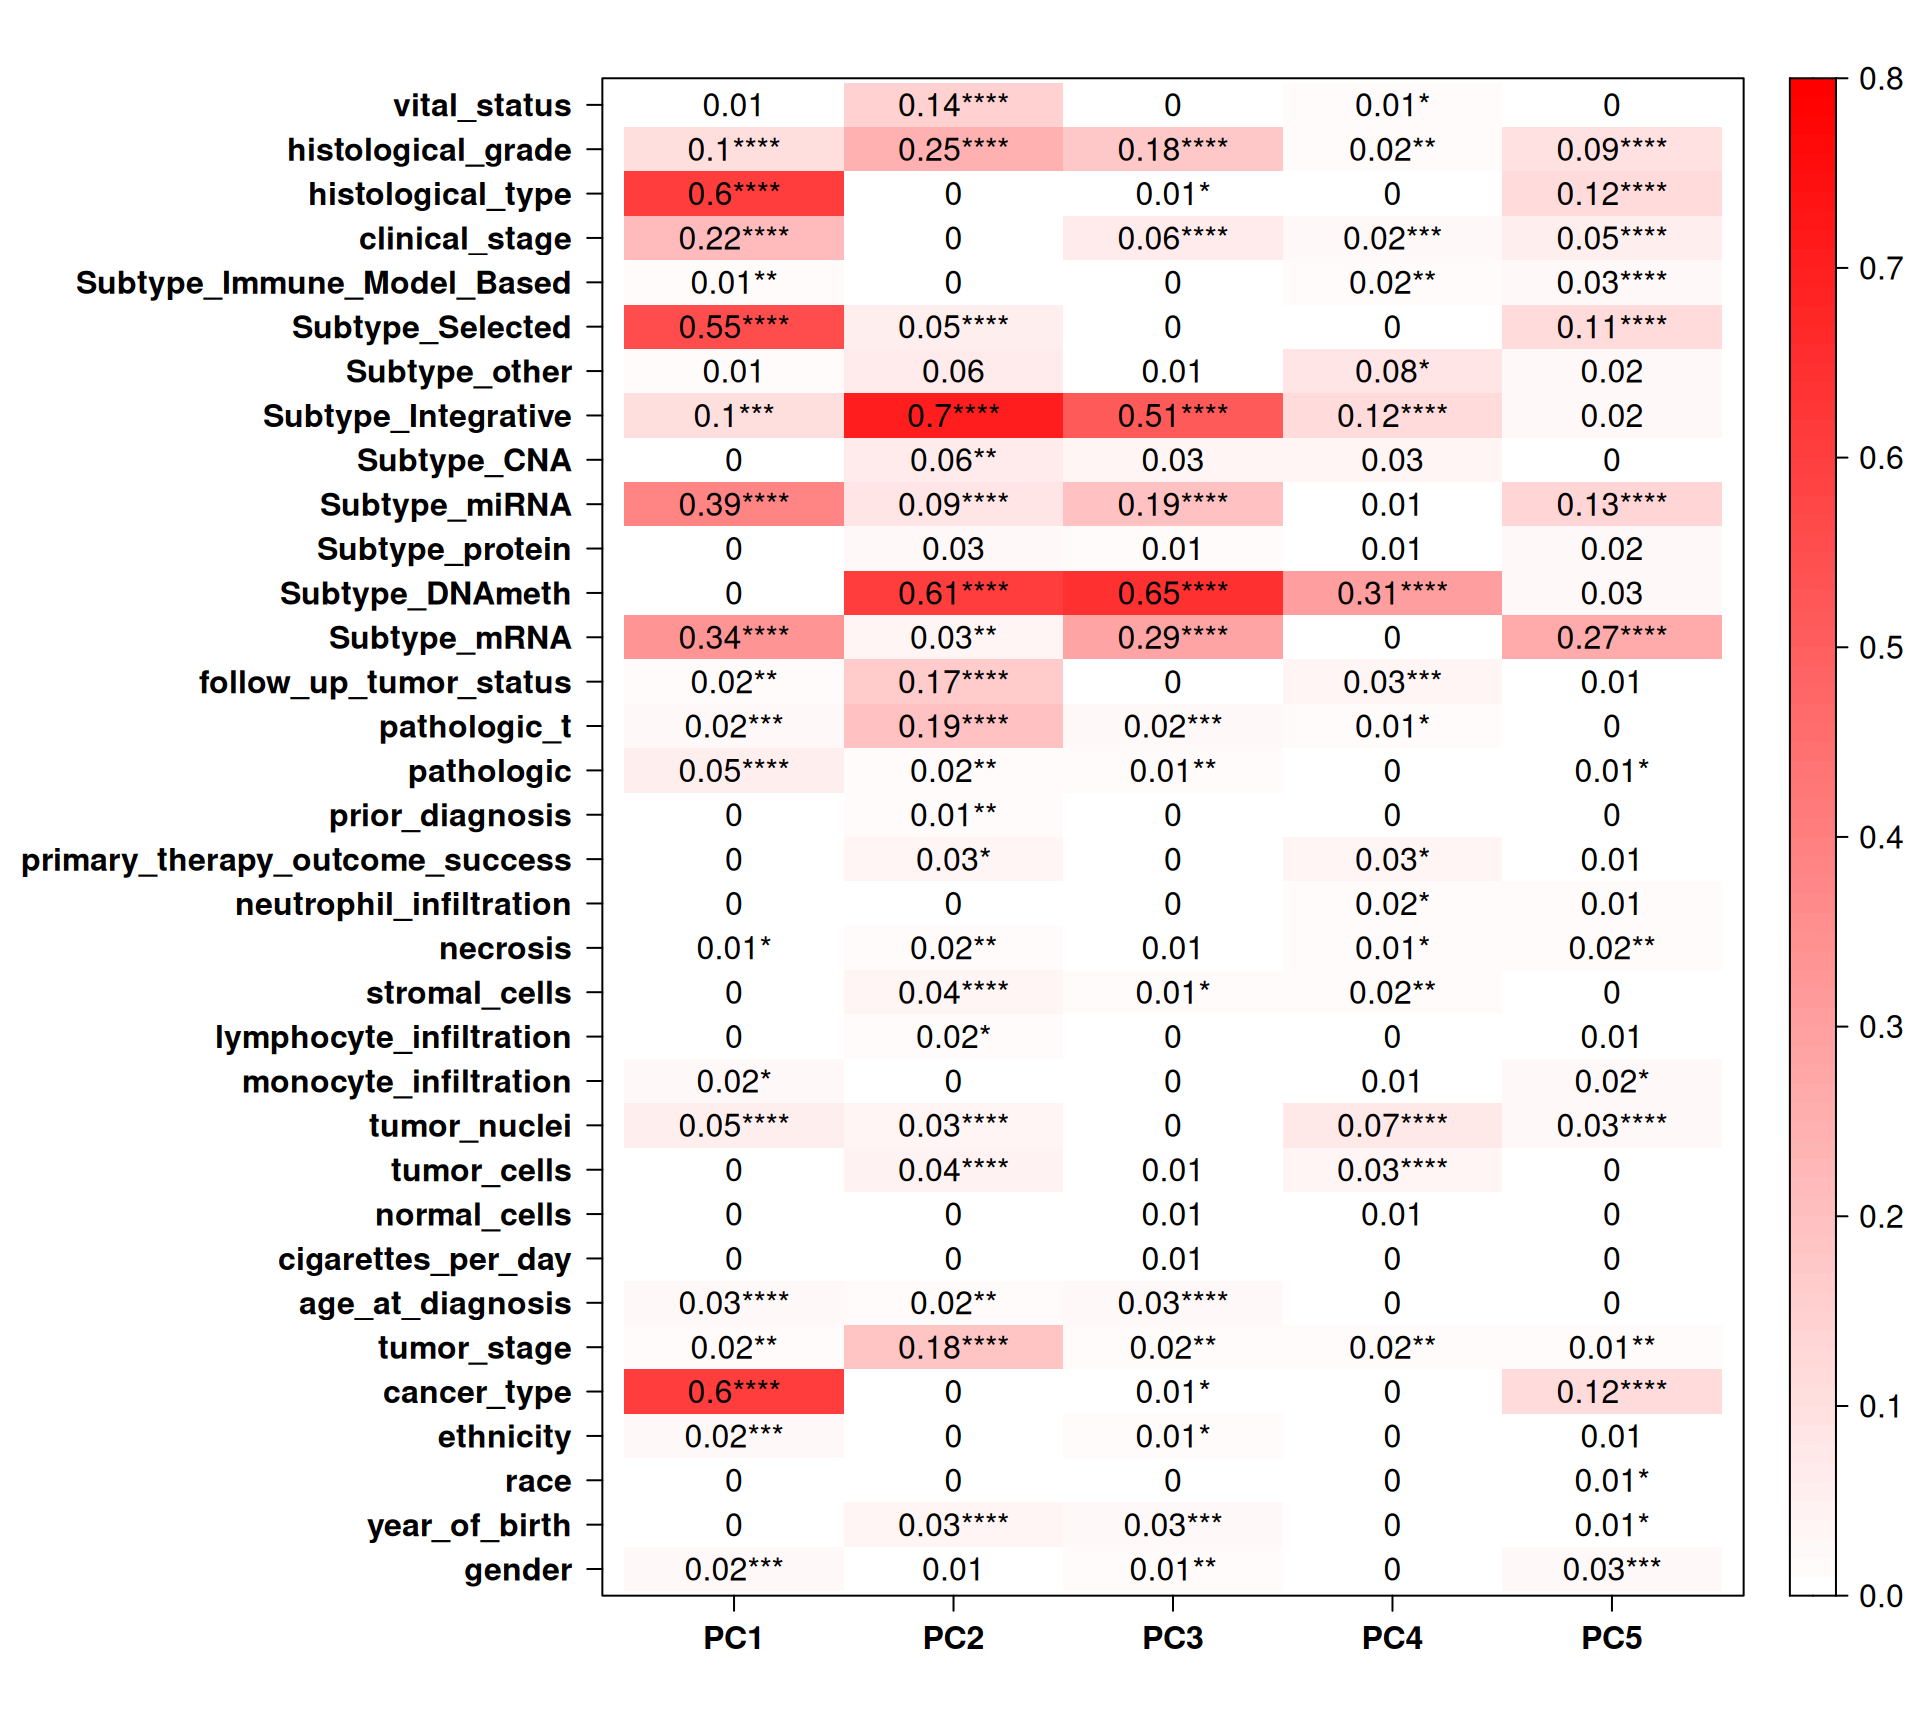
Let’s now check the Pearson correlation with other clinical covariates.
Cancer type strongly correlates with PC1 (~13% of observed variance) and PC5 (~3% of observed variance), which is concordant with what we have observed in the PCA pairplots: the three kidney carcinoma types are well separated in these components. PC1 also correlates well with hystological grade, selected subtype, subtype miRNA and subtype mRNA. PC2 (~10% of observed variance) and PC3 (~6% of observed variance) strongly correlates with subtype integrative, but more interestingly with subtype DNAmeth, histological grade, tumor stage, follow up tumor status and vital status. Indeed, the PCA pairplots shows that PC2 and PC3 cluster and separate very well biopsies from KICH, KIRC and KIRP patients, despite these two components not correlating with cancer type. More interestingly, subtype DNAmeth co-correlates with residual disease, more advanced cancer and worse prognosis, suggesting that DNA methylations and epigenomics plays a major role in cancer evolution and disease outcome.
5.4.3 Differential Methylation Analysis
Let’s move forward now to the differential Methylation analysis. We will take two complementary approaches:
- Probe-Wise Differential Methylation
- Region-Wise Differential Methylation (DMR)
The Probe-Wise Differential Methylation has a higher granularity (down to the single probe) allowing for a more precise characterization of the methylation status across the kidney carcinomas, but with the shortcoming of a more complex interpretation of the results. Gene / Region-Wise Differential Methylation approach, on the other hand, summarize the methylation status at the gene or at the region level, making comparisons and interpretation easier, with the downside of losing the signal of the methylation status of each CpG island.
5.4.3.1 Probe-Wise Differential Methylation
For epigenomics, we use two arbitrary thresholds to retain genes that are significantly differentially methylated across the each comparison: an absolute logFold-Change (logFC) higher than 2, and an adjusted p-value lower than 0.05. This results in:
- KIRC_vs_KICH, 5,672 differentially methylated probes, 3,867 hypermethylated and 1,805 hypomethylated
- KIRP_vs_KICH, 8,024 differentially methylated probes, 6,403 hypermethylated and 1,621 hypomethylated
- KIRC_vs_KIRP, 954 differentially methylated probes, 163 hypermethylated and 791 hypomethylated
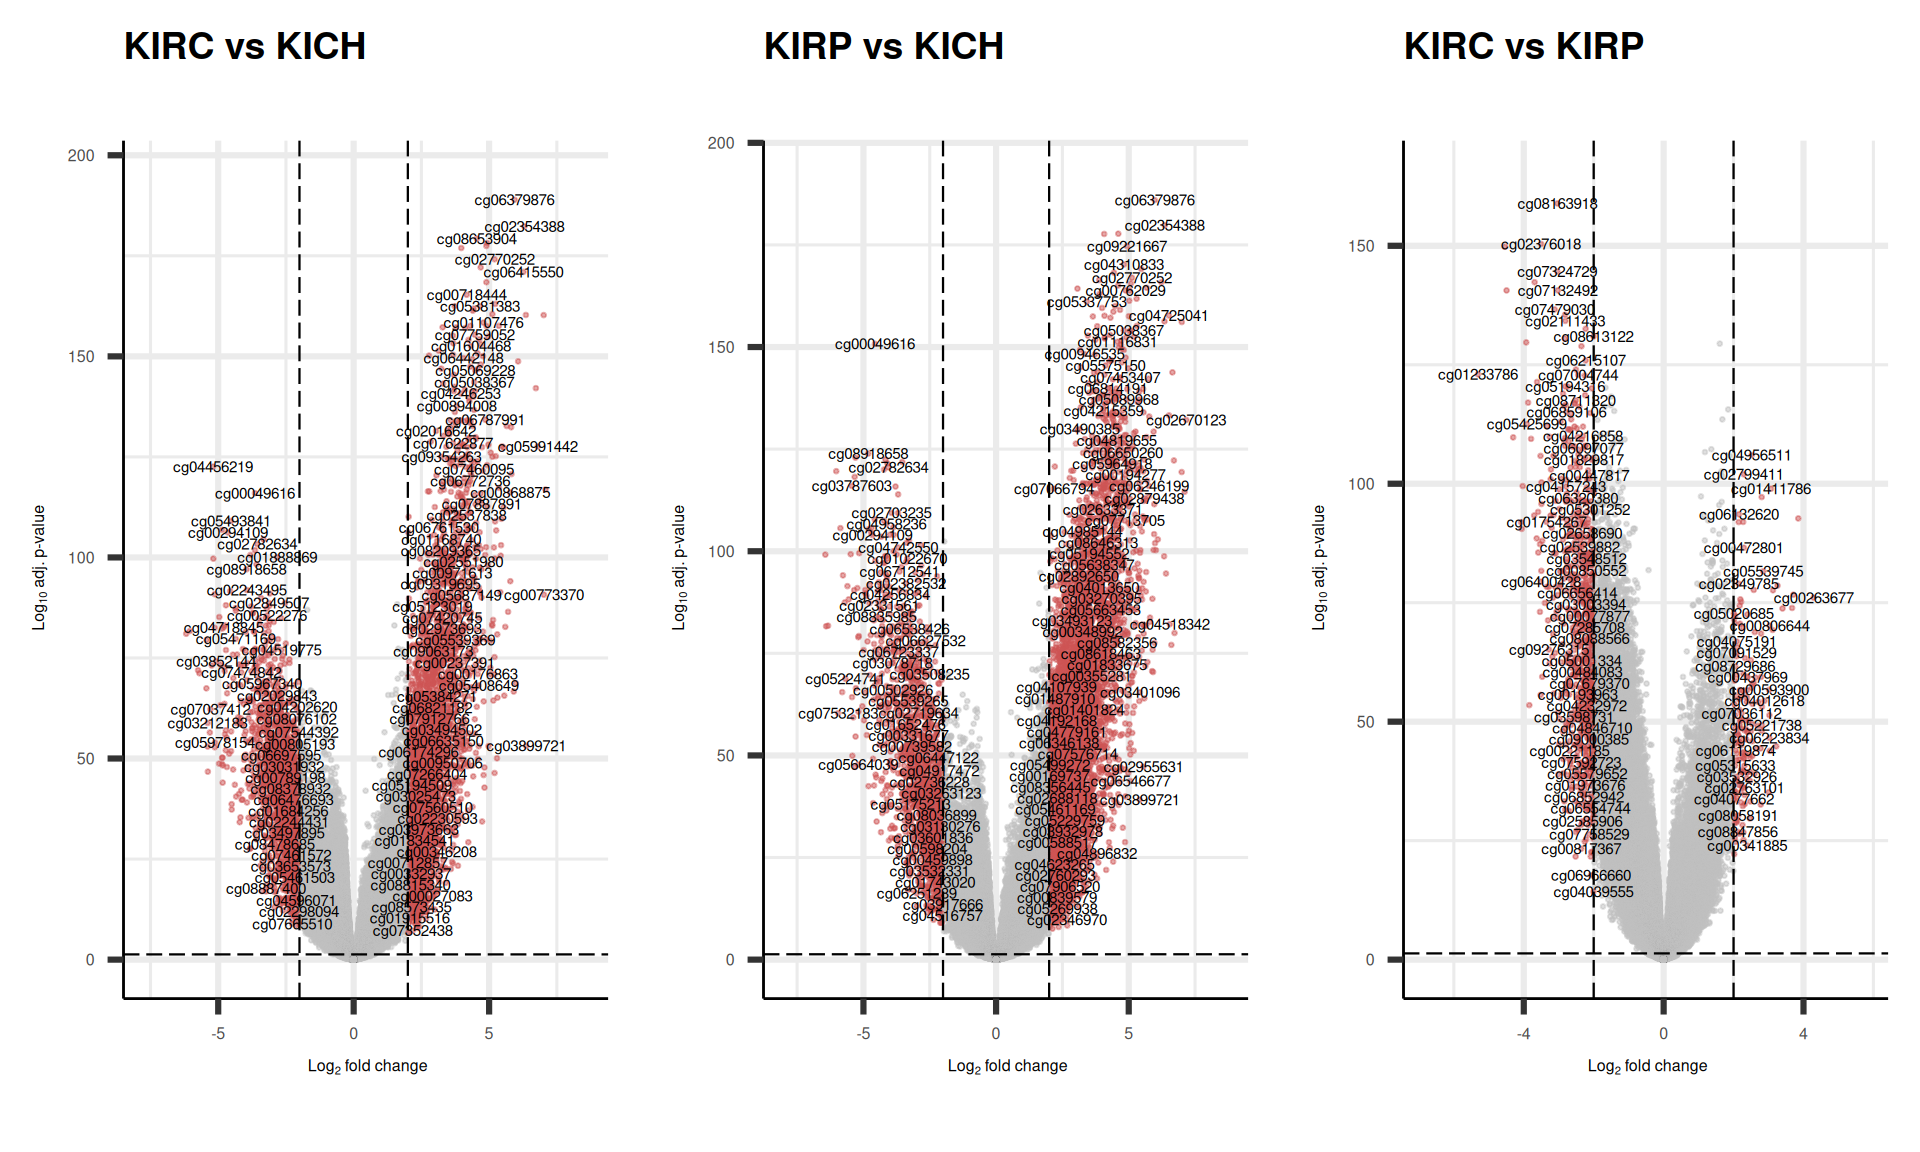
As usual, we can visualize the logFC p-values relationships for all the probes with a volcano plot.
KICH appears to have the highest amount of hypomethylated probes, suggesting that many of their genes are expressed due to the hypomethylation of the corresponding CpG islands. On the other hand, KIRP seems to have the highest amount of hypermethylated probes of the three kidney carcinoma types, followed by KIRC.
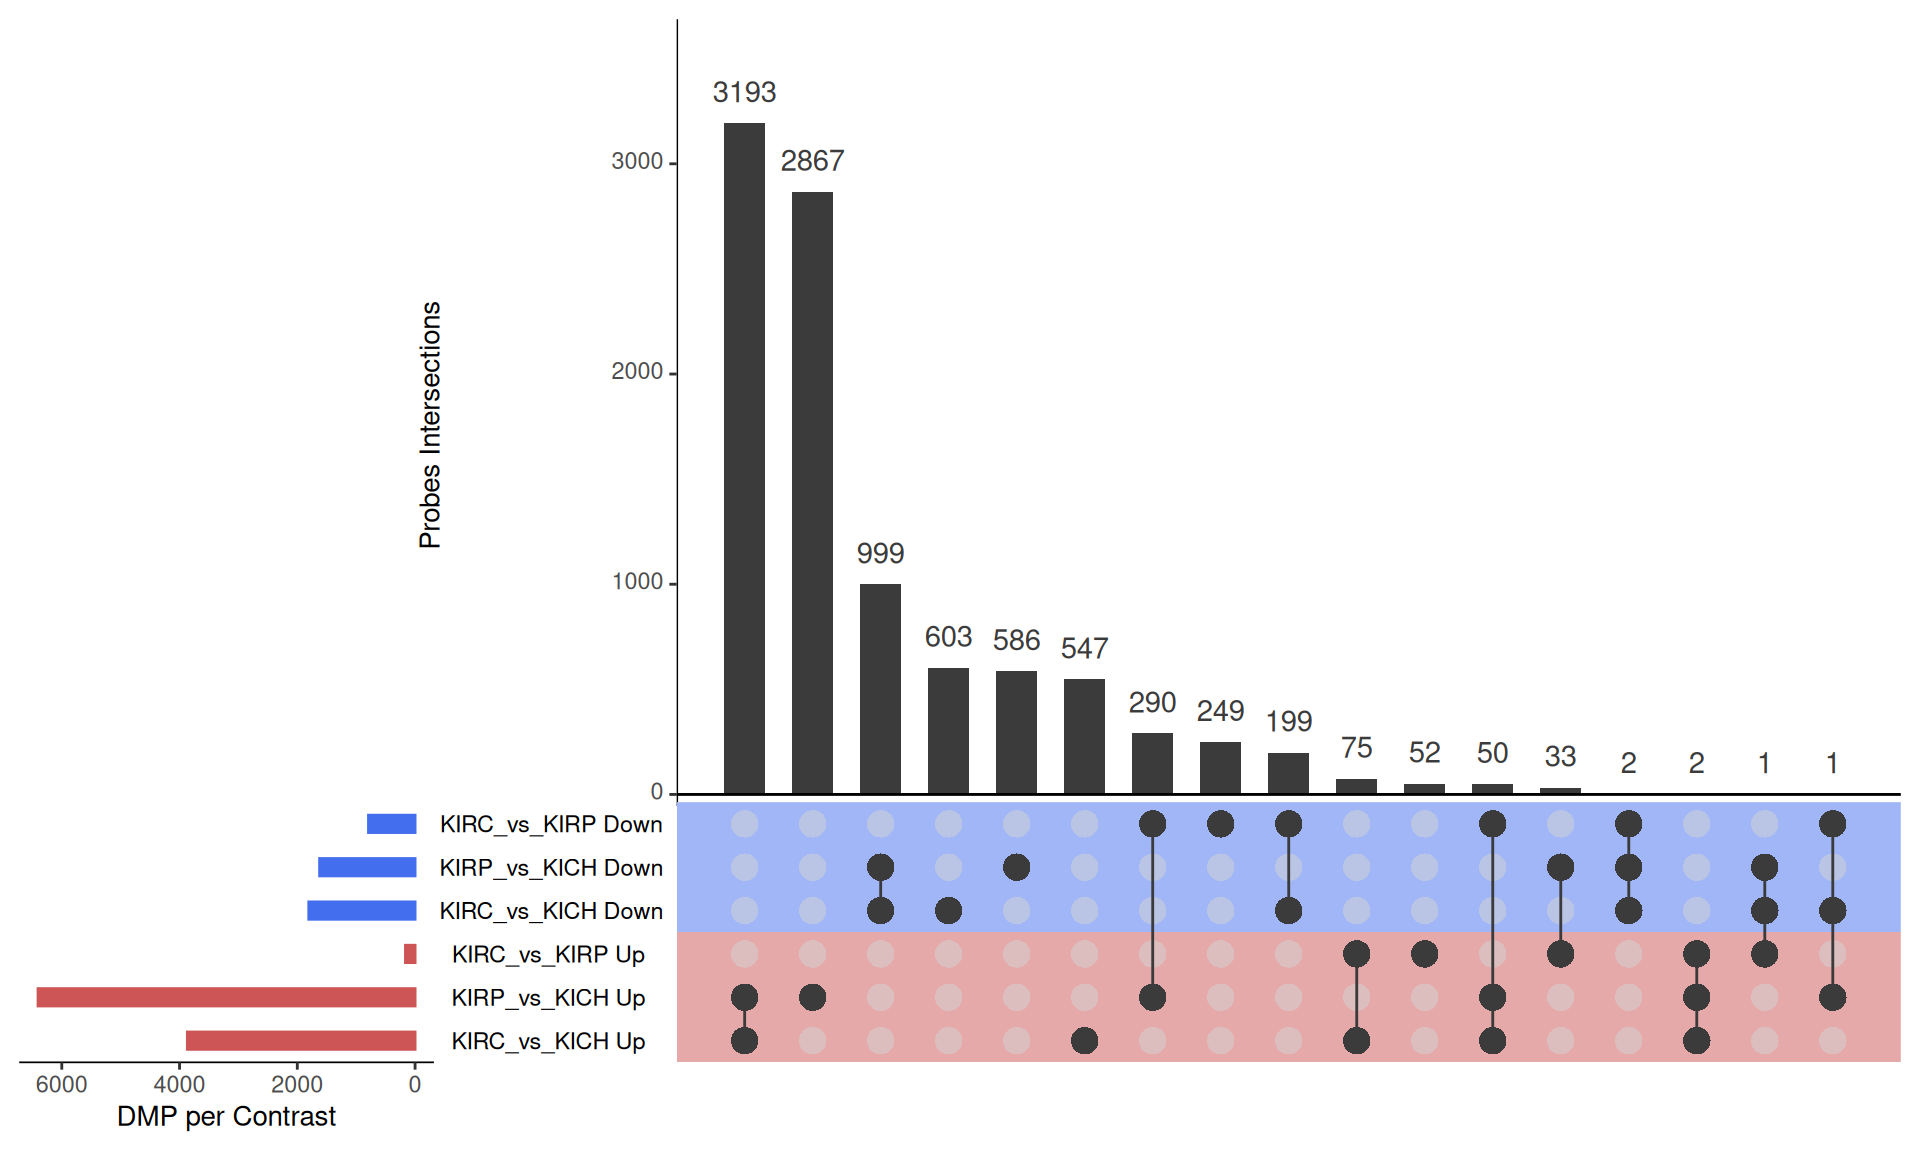
The UpSet plot shows that KICH has a strong signature of 3,193 hypomethylated probes that are instead hypermethylated in KIRC and KIRP, and 999 hypermethylated probes that are insted hypomethylated in KIRC and KIRP. This methylation pattern can be ascribed to the fact that KICH carcinomas in general maintain their epithelial differentiation status, which instead is more often lost in KIRC and KIRP carcinomas. KIRP appears as the kidney carcinomas with most hypermethylated probes when compared to KIRC and KICH.
Tables of differentially methylated probes.