8 Characterization of Factor 3
8.1 On this page
Biological insights and take-home messages are at the bottom of the page at section Lesson Learnt: Section 8.7.
- Here we perform a clinical and molecular characterization of the patients the fall into the Factor 3 identified with the multi-omics factor analysis (see Chapter 6). Patients that belong to Factor 3 have in fact a higher risk for a worse clinical outcome (see Chapter 7).
- First, we test the association of Factor 3 with multiple clinical covariates, such as the tumor stage, its histological grade and pathological grade.
- Then, we identify the multi-omics signature of Factor 3, and we build a gene-interaction network for the top molecular features associated with Factor 3.
- Finally, we look for specific CNV or somatic mutation signatures overrepresented in Factor 3 patients.
8.2 Factor 3 overepresentation across clinical groups
Factor 3 seems slightly associated with the tumor severity and the covariates pathologic tumor grading, subtype selected, tumor cells, tumor nuclei, tumor stage, tumor status and vital status (see Chapter 6). And indeed, we have confirmed with the survival analysis (see Chapter 7) that patients that belong to Factor 3 have in fact a higher risk for a worse clinical outcome.
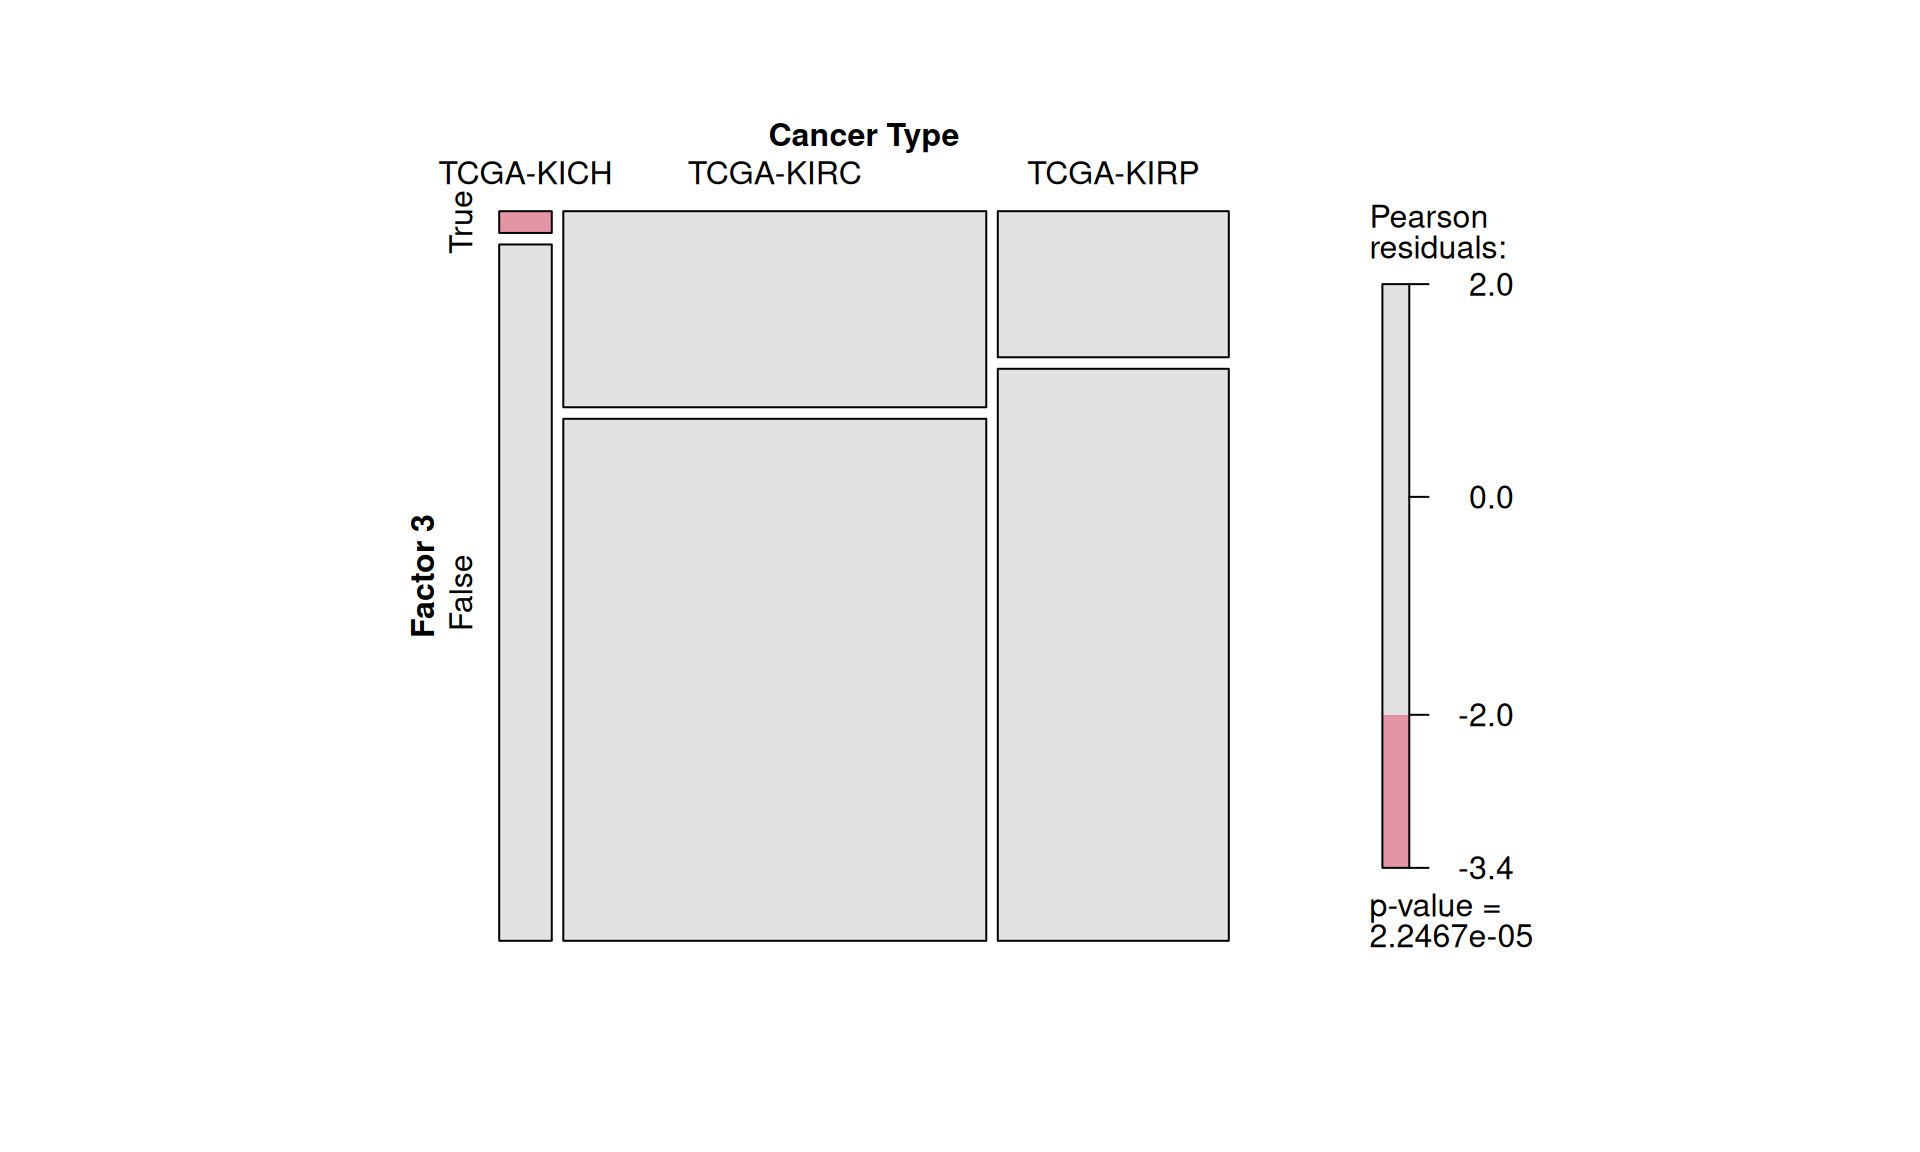
We can statically test the association between Factor 3 and clinical metadata that we have observed correlating with it. First, we classify patients into belonging to Factor 3 or not by determining the right cut-off on Factor 3 weights with the surv_cutpoint function of the survimner package. This results in 206 Factor 3 patients and 681 patients that do not belong to Factor 3. Similarly to what we have done in Chapter 1, we run demographic statistics (chi-squared and Fisher exact tests) to see if any clinical covariate is significantly overrepresented in Factor 3 patients, under the null hypthesis that the distribution of each covariate in the two patients groups is the same.
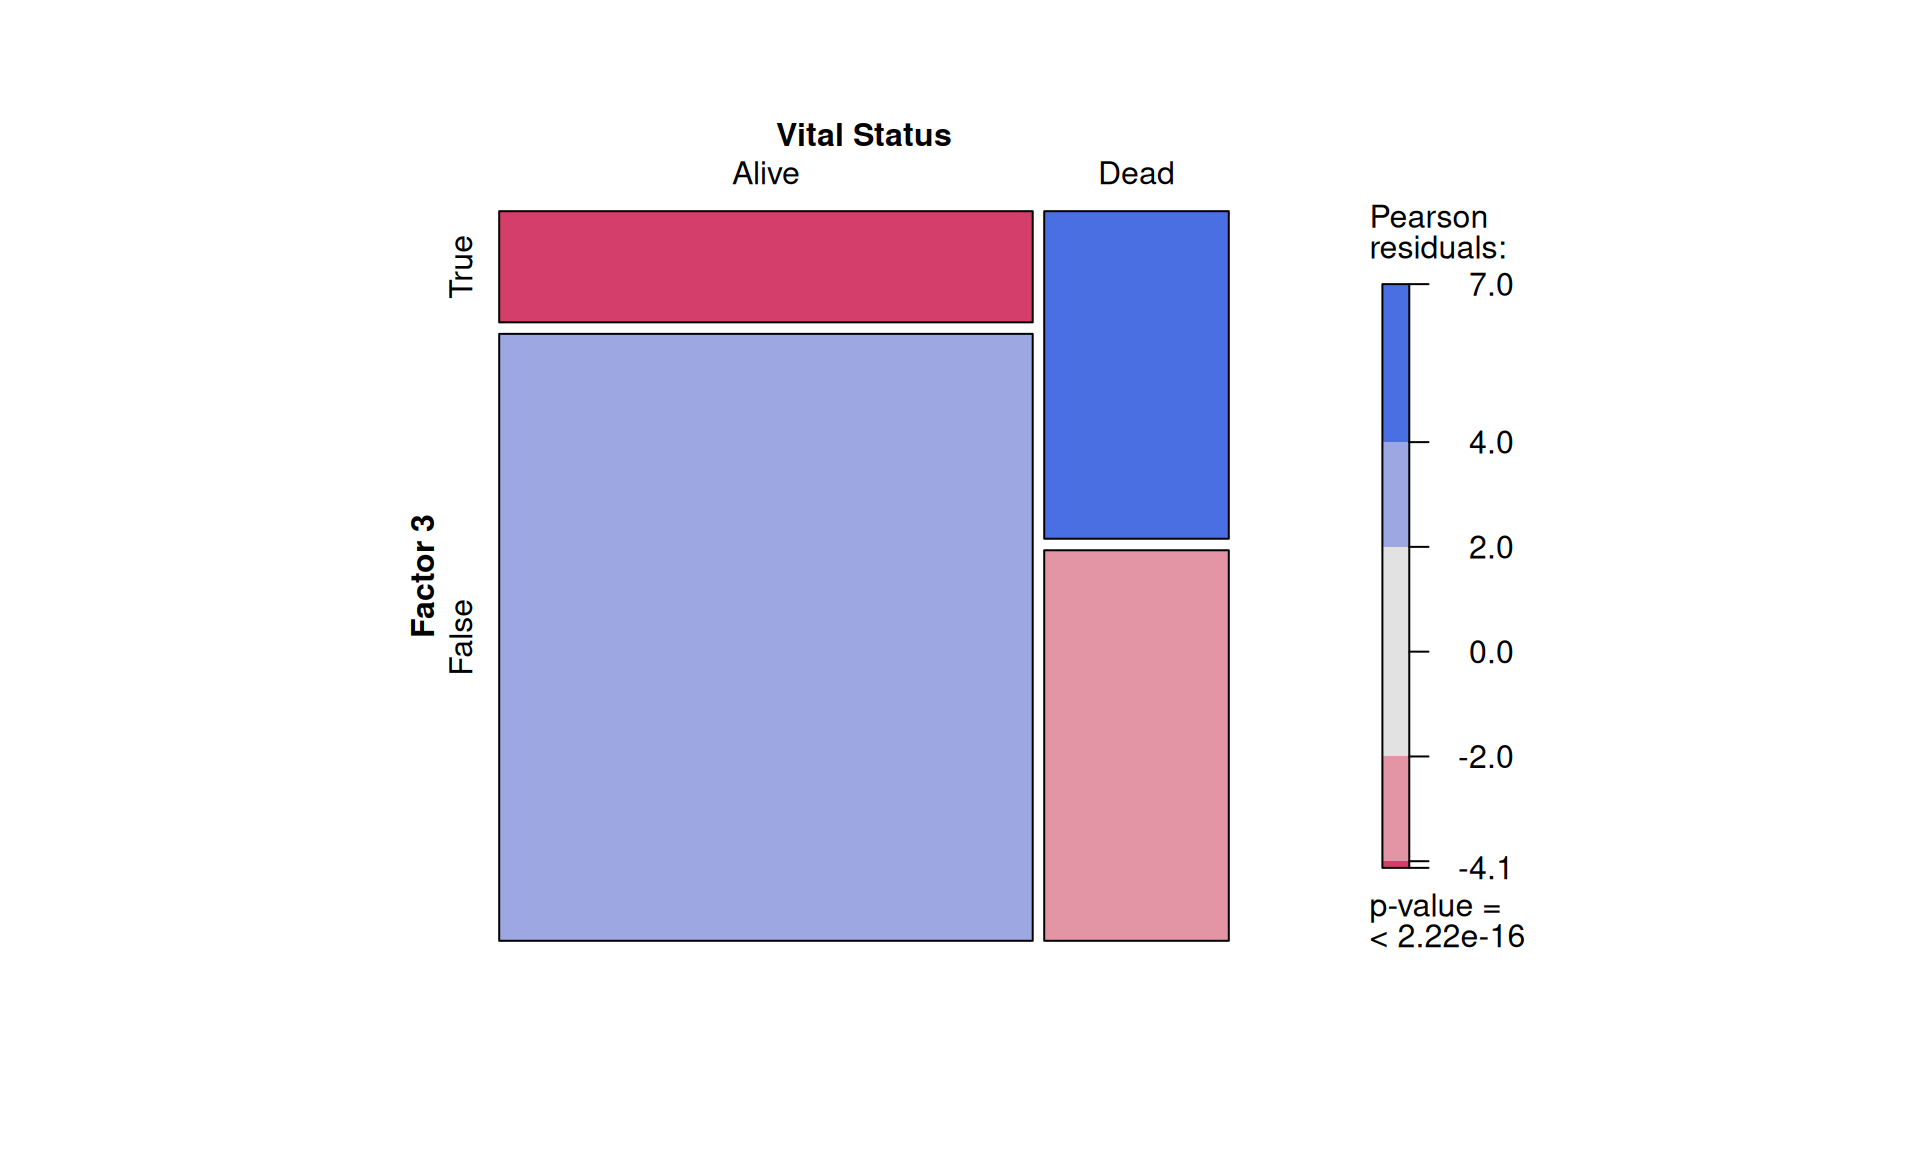
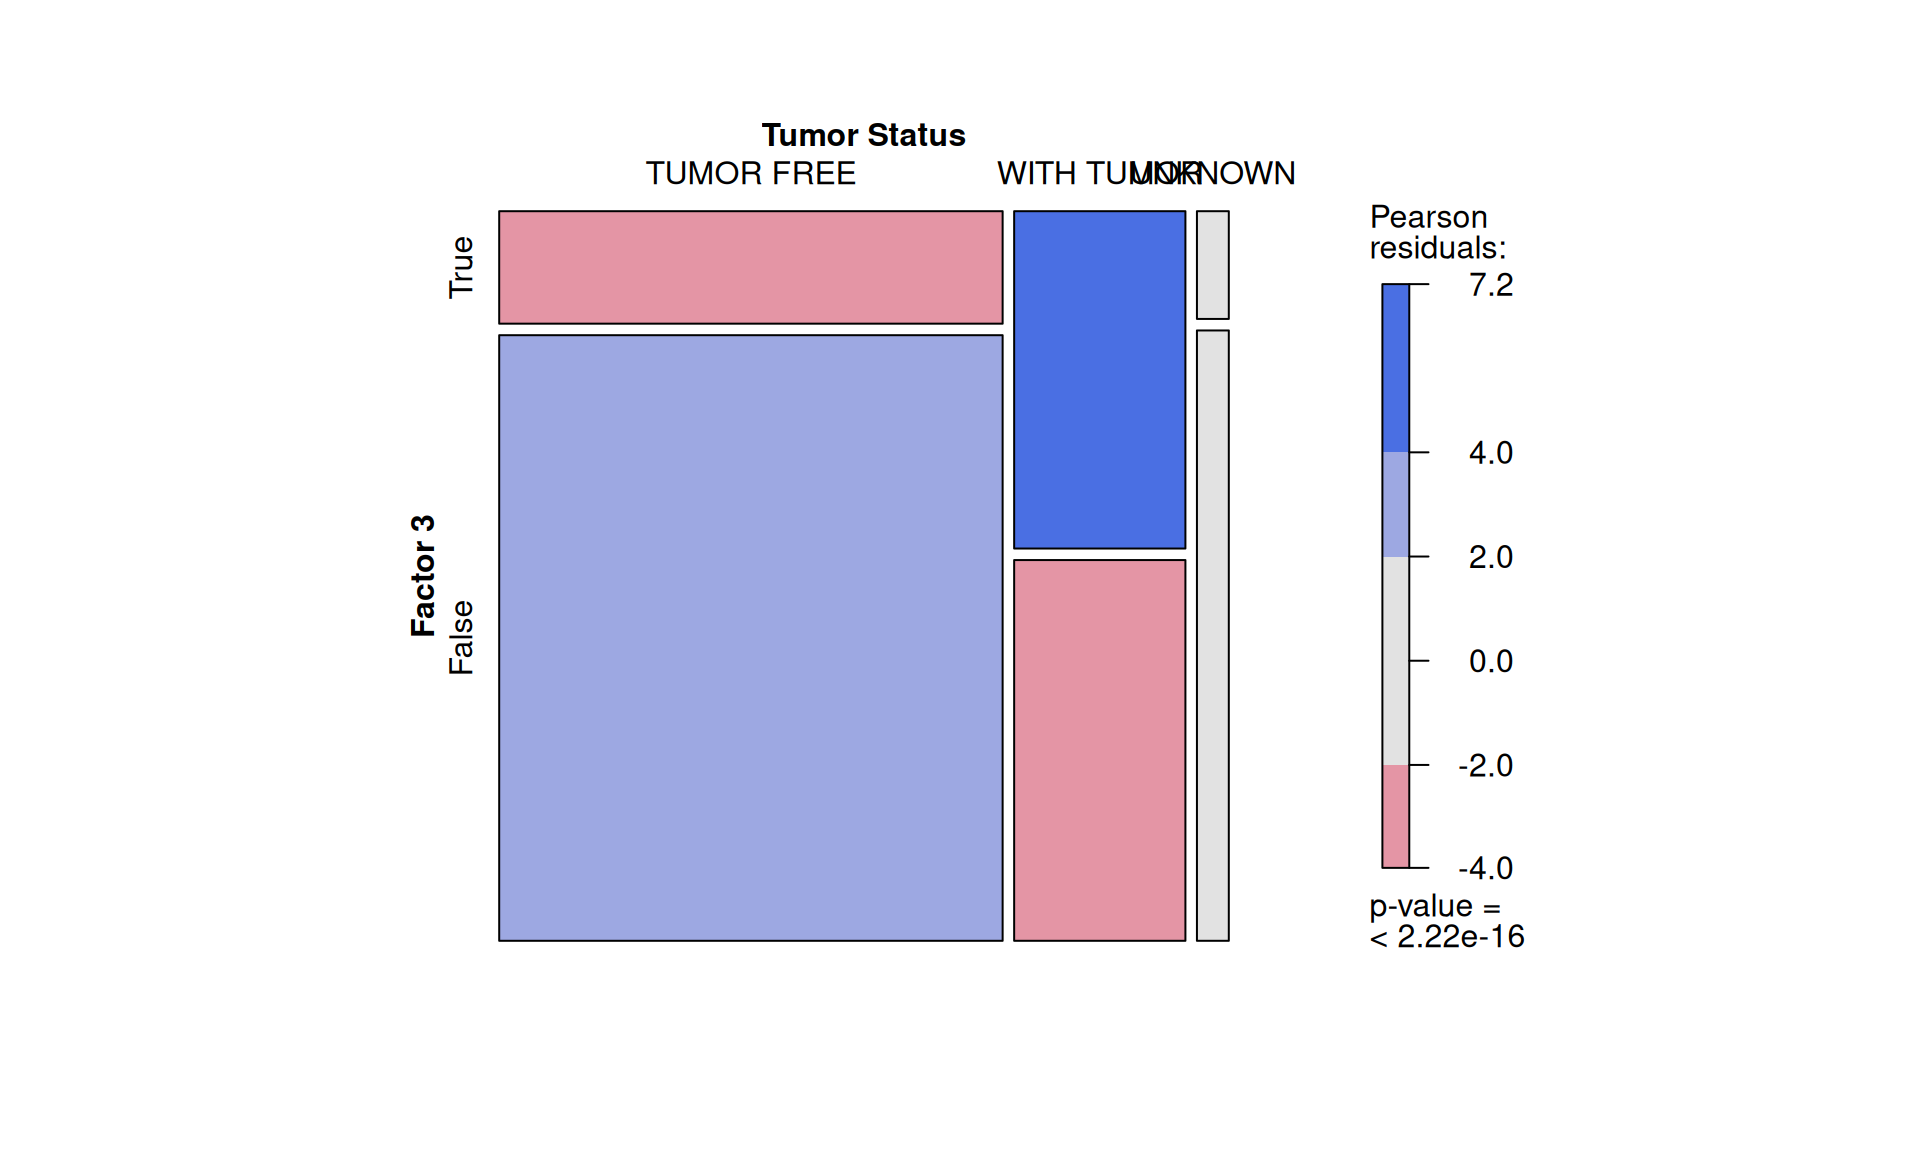
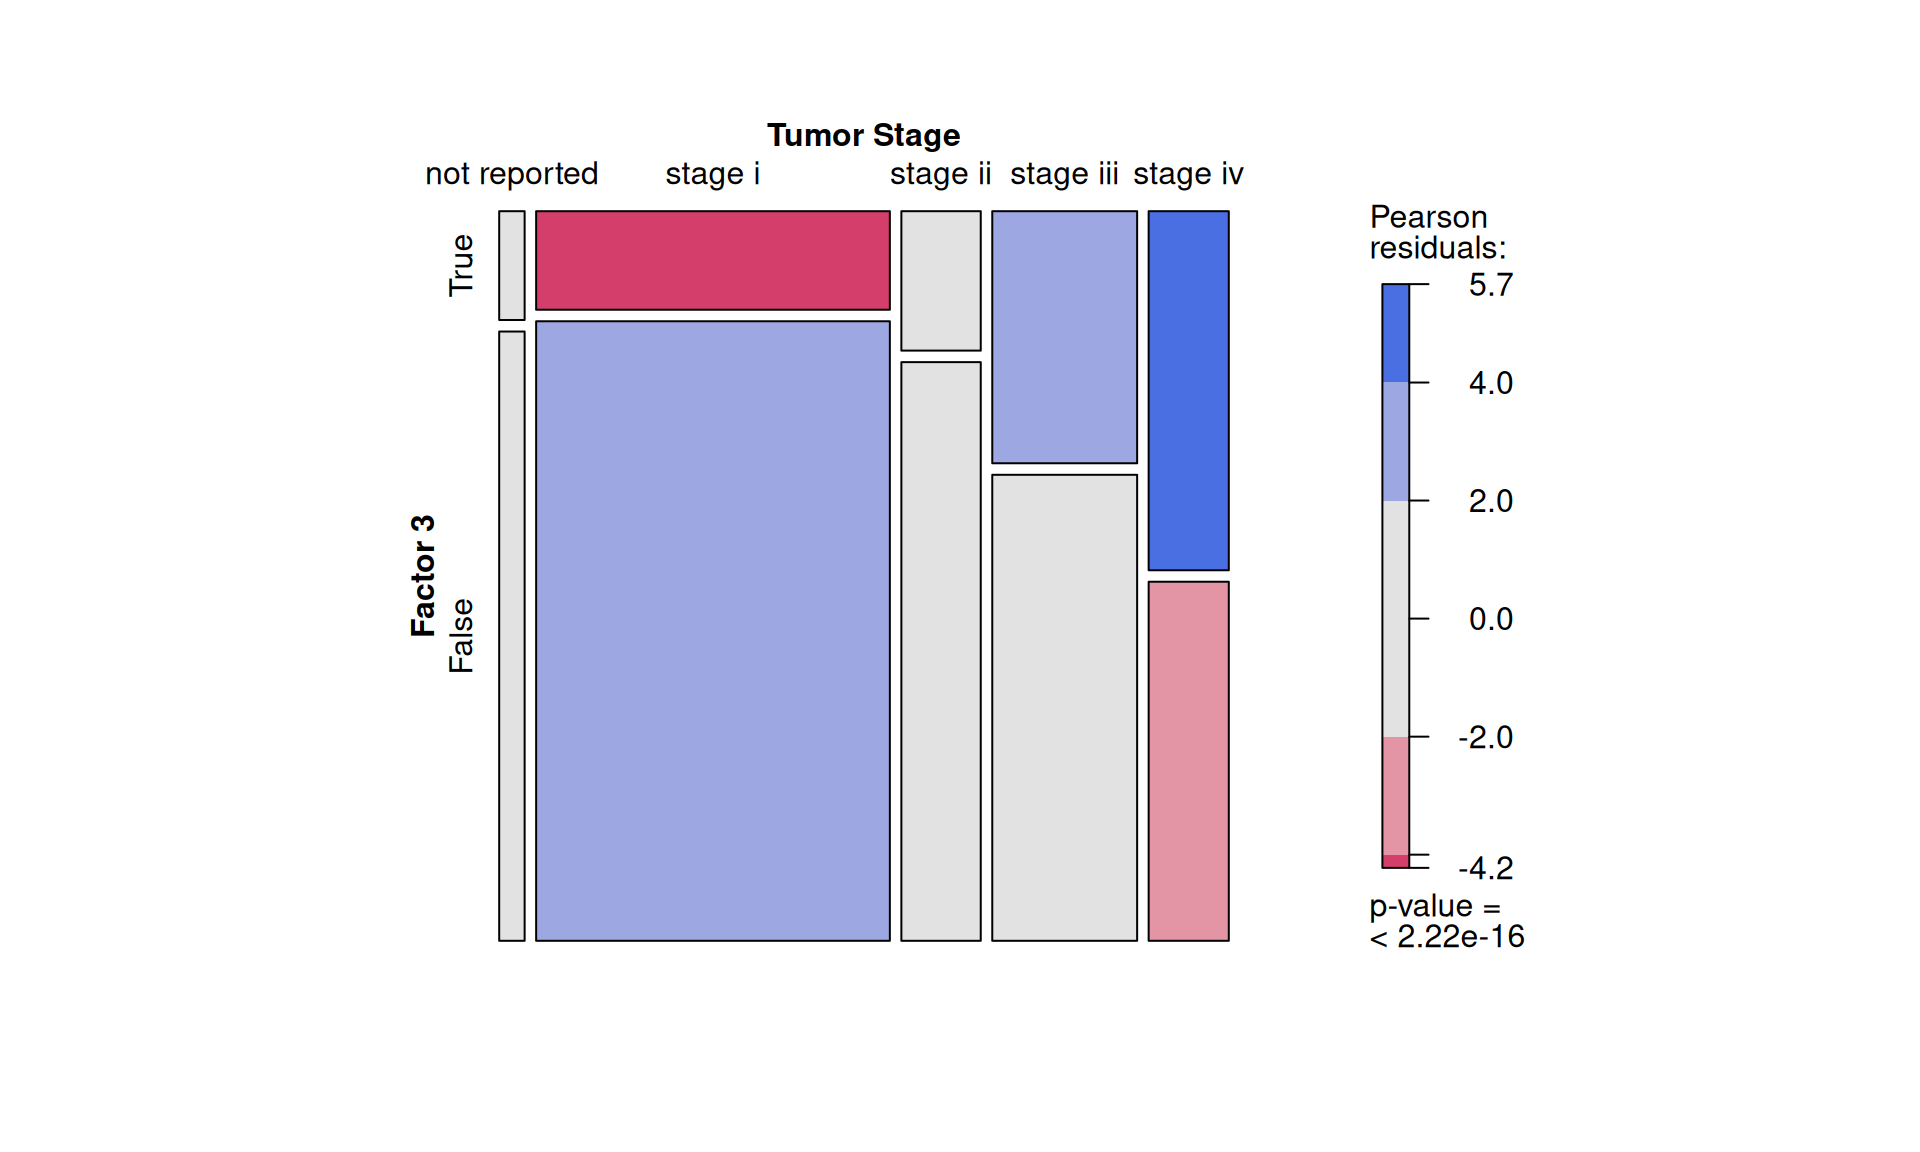
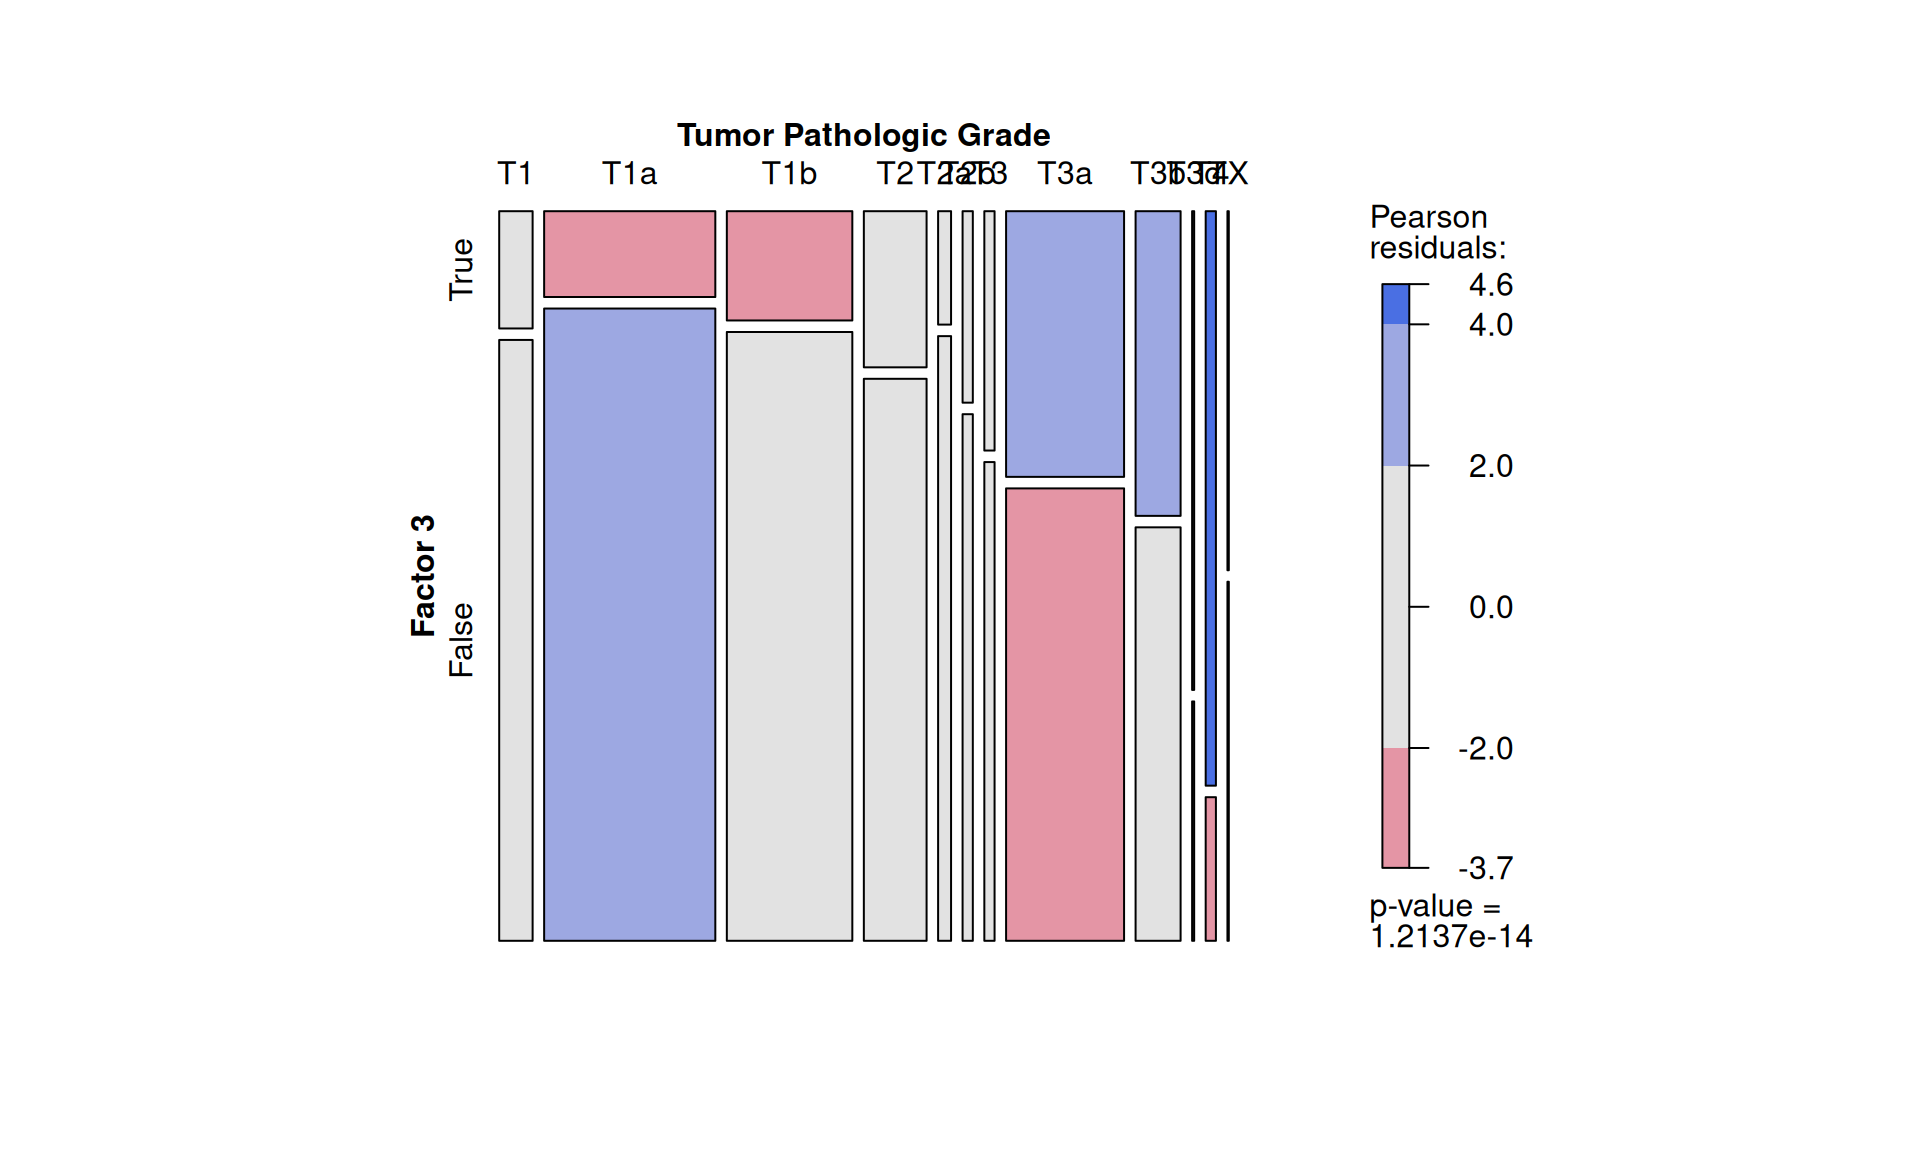
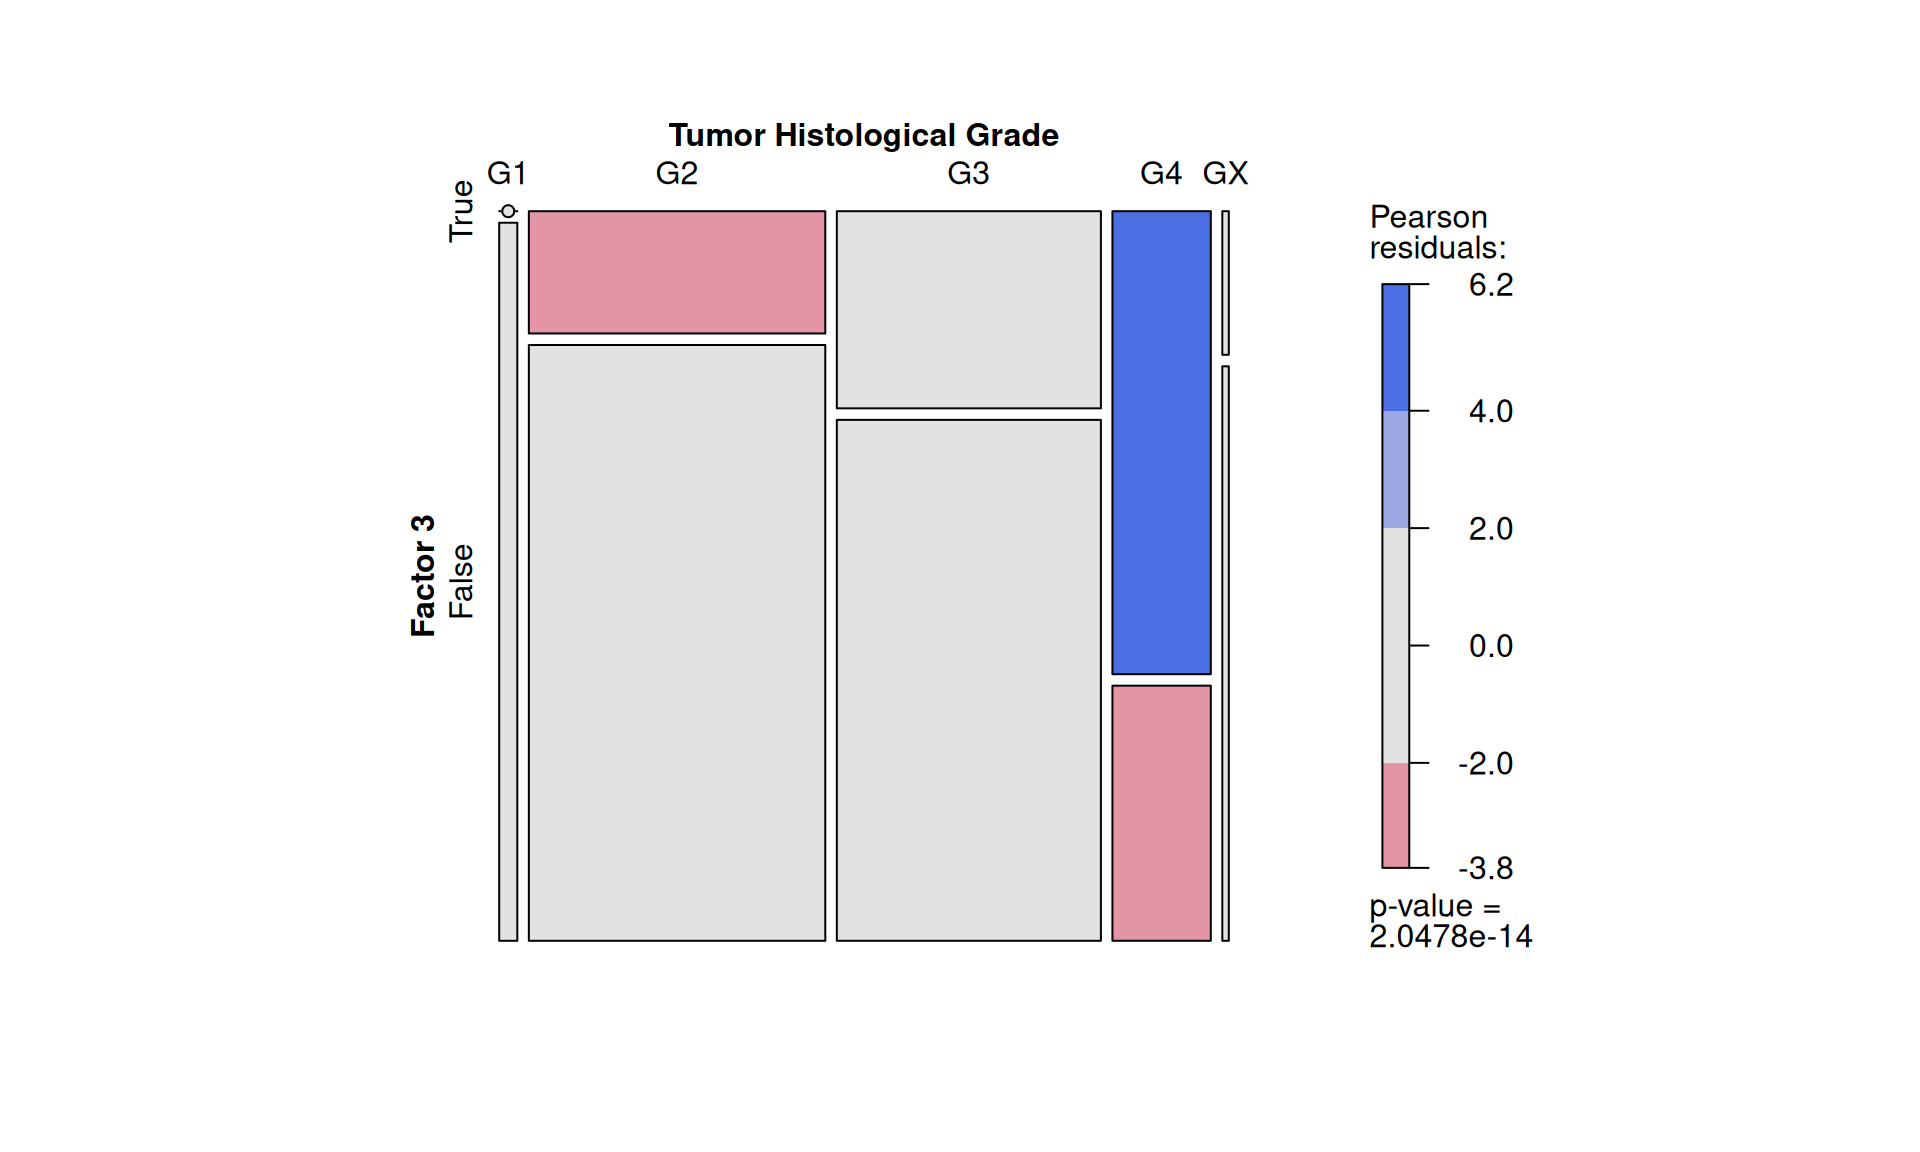
To confirm our observation that KIRC is not strictly associated with worse outcome, we see that Factor 3 patients are not overrepresented in any of the three kidney cancer types, however, KICH patients are underrepresented. Factor 3 patients have a significant higher chance to be dead or to have residual disease. We can also observe a interesting pattern for the tumour advancement (tumor stage, tumor pathological grade, tumor histological grade): Factor 3 patients are proportionally underrepresented in early tumors and more overrepresented in more advanced tumours, suggesting that Factor 3 is associated with tumor progression.
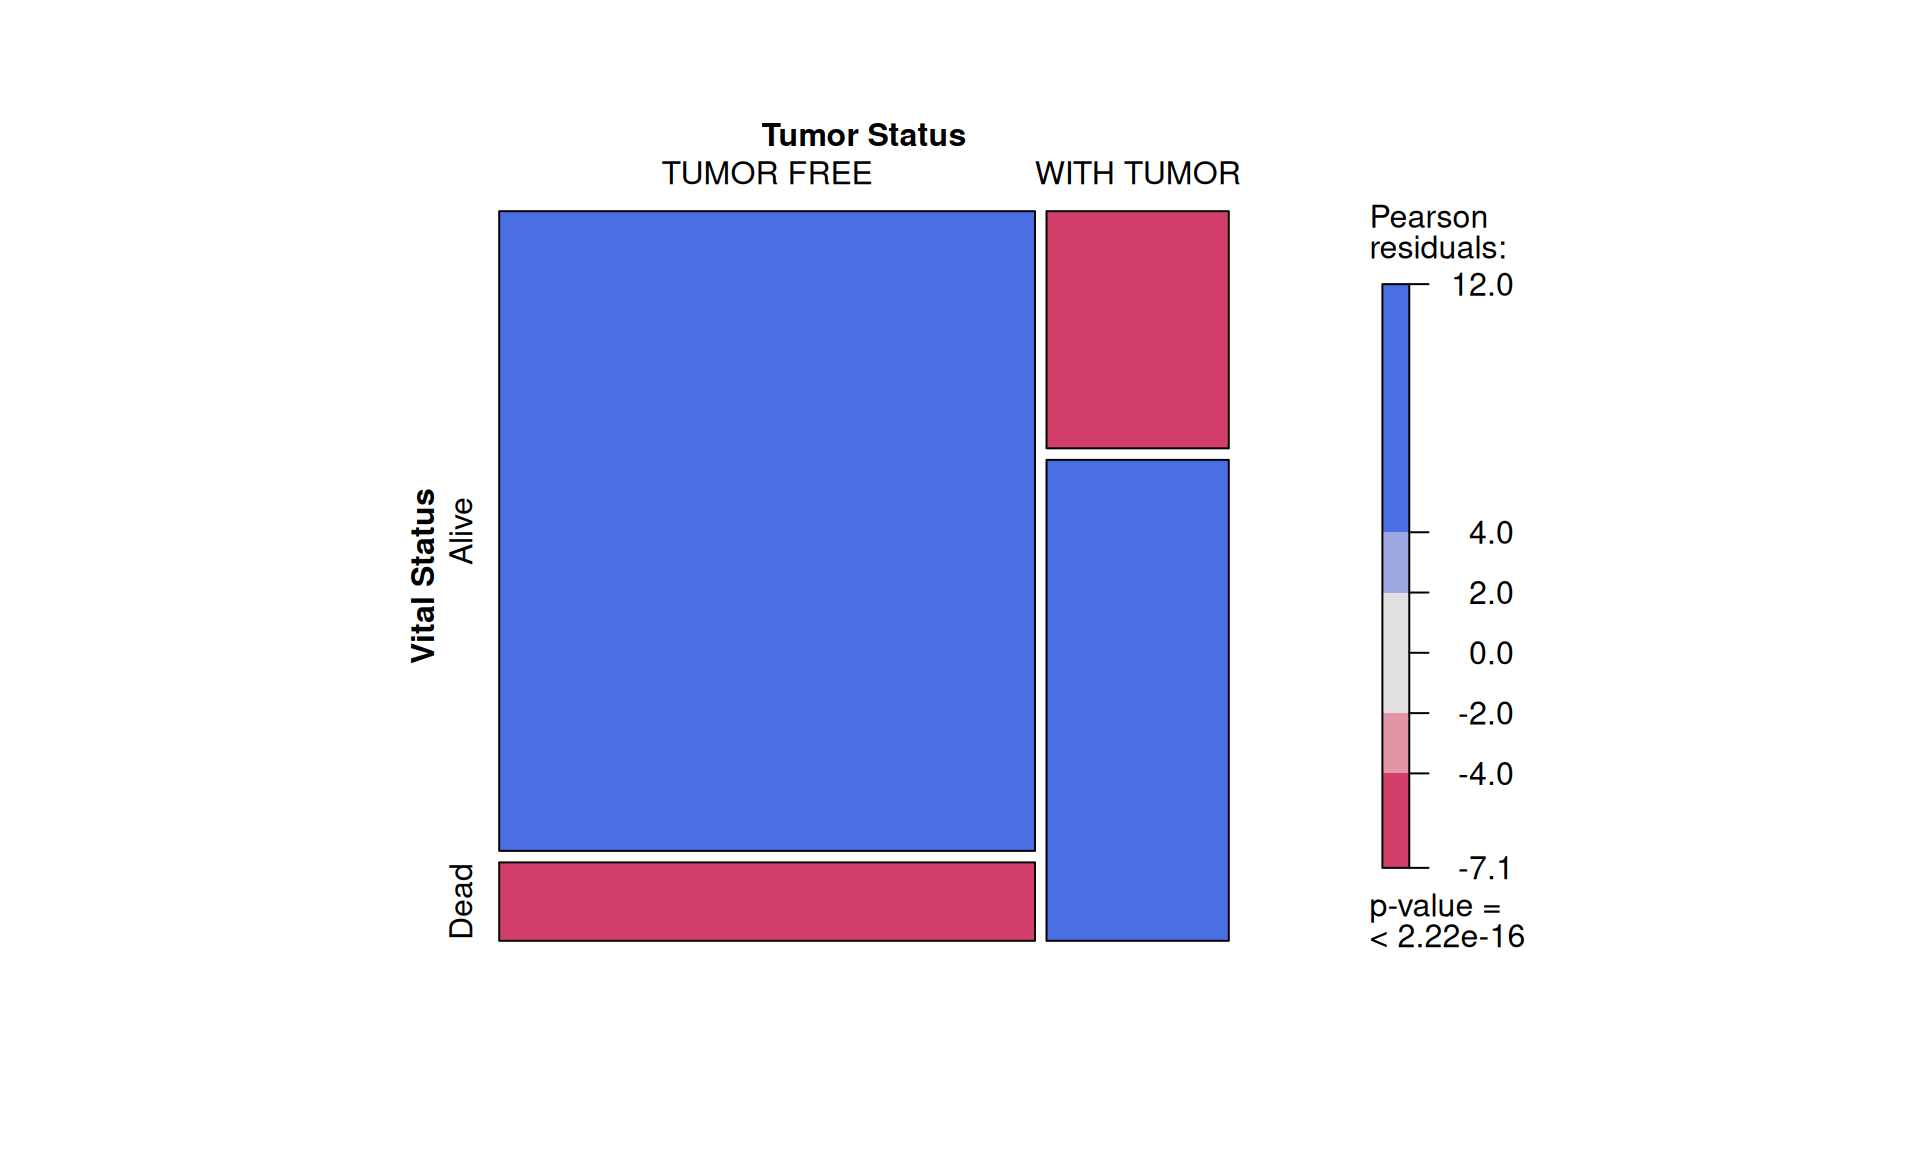
Intuitively, residual disease is associated with worse clinical outcome. Indeed, we can observe a strong association between residual disease and worse outcome (p-value < 2.22e-16). Since Factor 3 seems overrepresented in patients with residual disease or worse clinical outcome, and it seems associated with hallmarks of tumor progression, a molecular characterization of Factor 3 could provide the opportunity to discover prognostic biomarkers for patients with kidney carcinomas as well as novel therapeutics targets to improve the clinical outcome.
8.3 Multi-omics signature
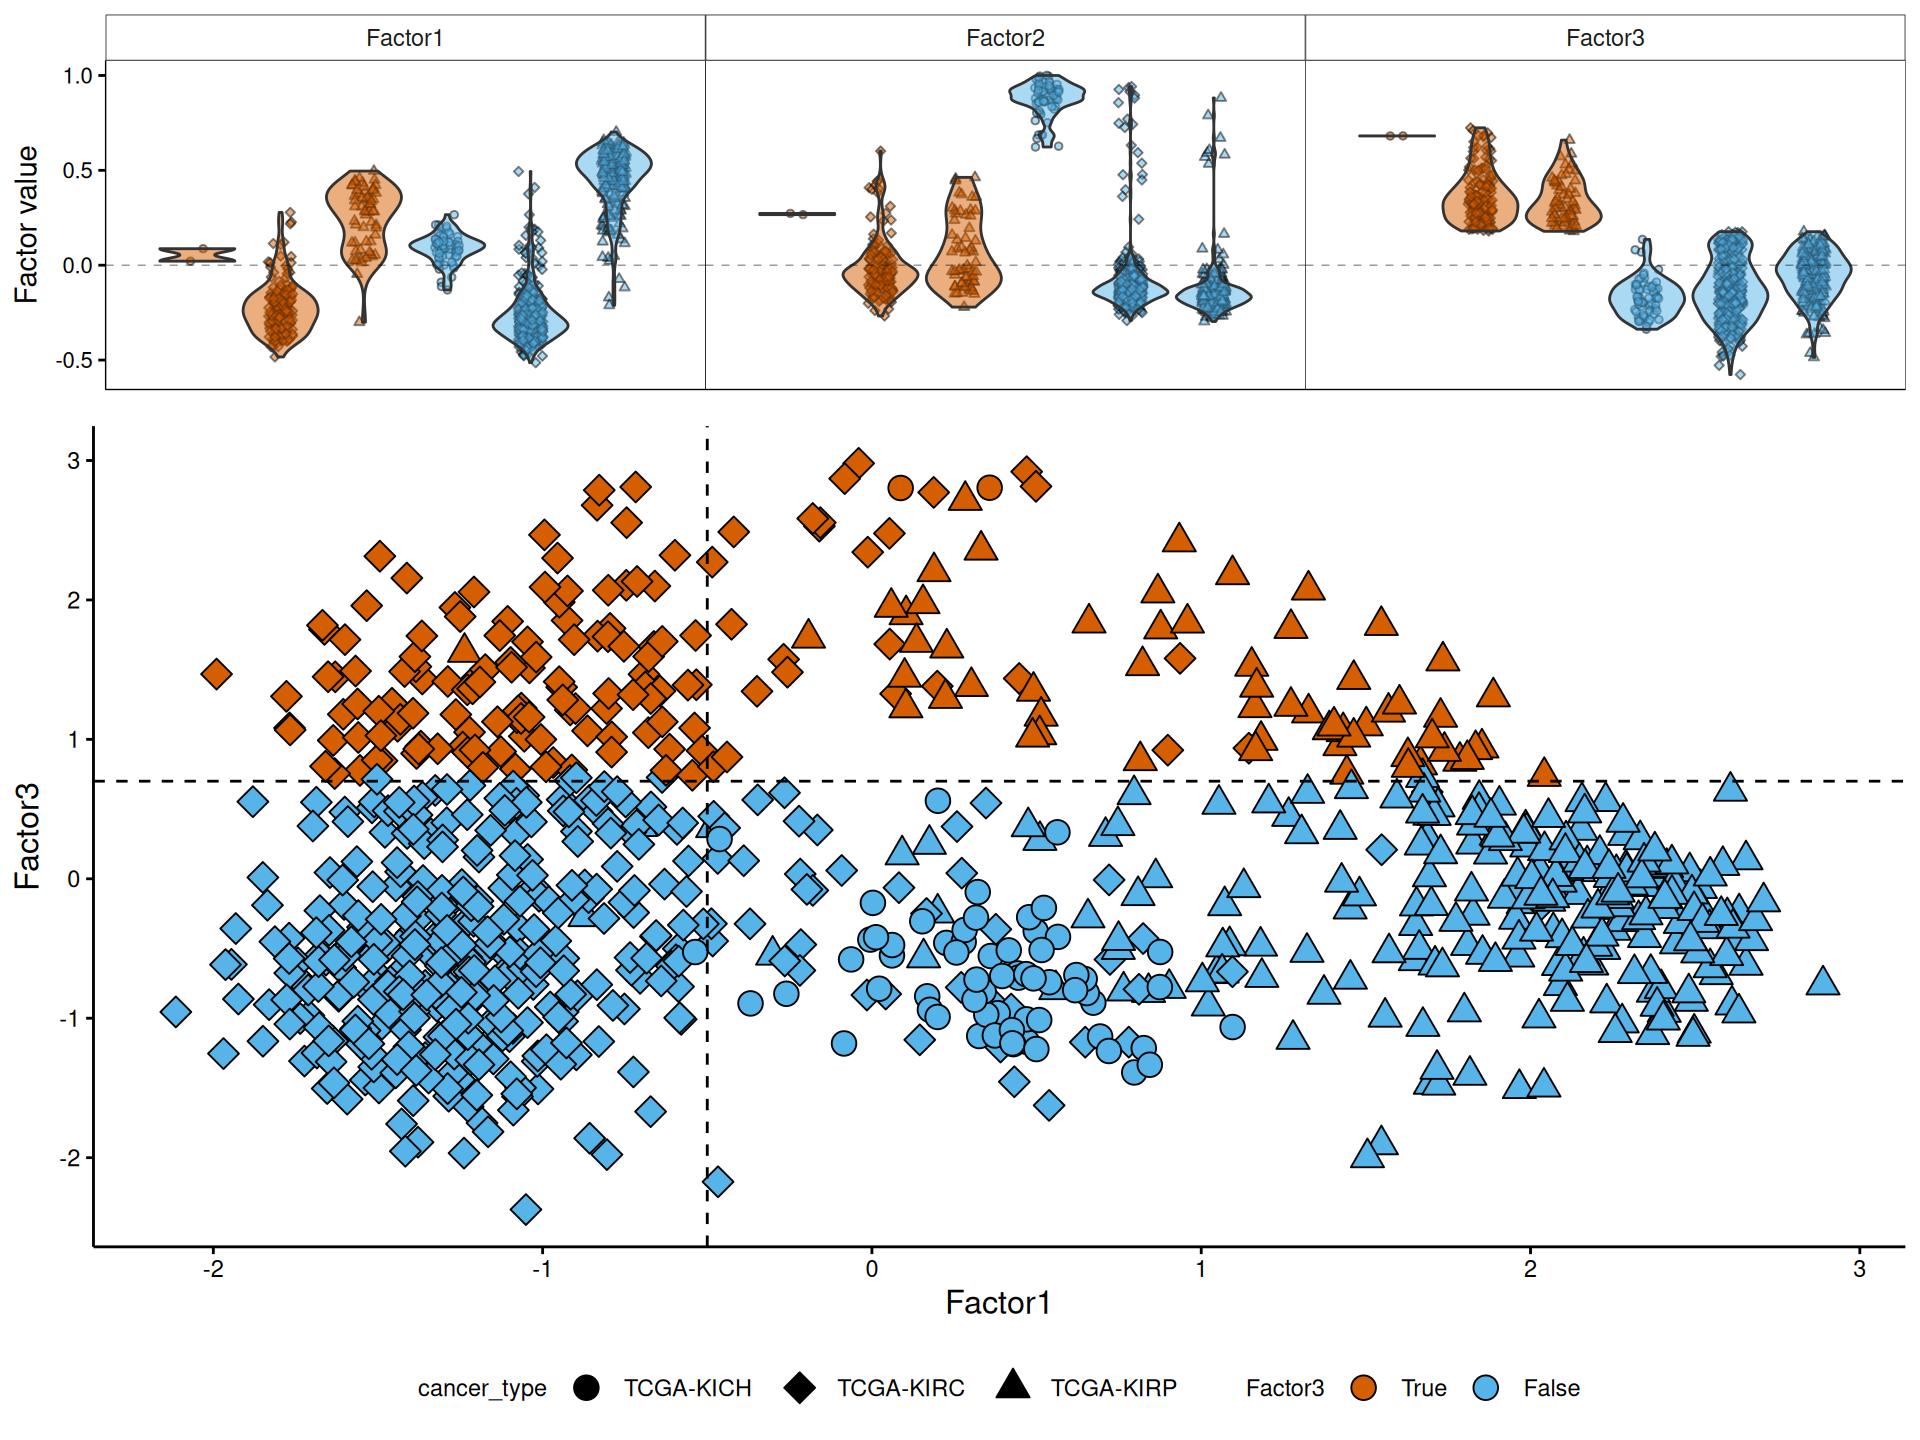
For the molecular characterization of Factor 3, we go back to the multi-omics factor analyses we have performed in Chapter 6 and we explore the how the patients are distributed across the first three factors. Interpretation of the factor analysis and the relative position of the samples across each factor is similar to the interpretation of the principal components in a PCA.
Indeed, we can confirm that KIRC and KIRP are not separated by Factor 3, and only 2 KICH patients belongs to Factor 3.
Let’s explore the contribution of each omics layer to Factor 3.
As usual, the interpretation of these high dimensional data is not straightforward, but we can pick on some emerging trends:
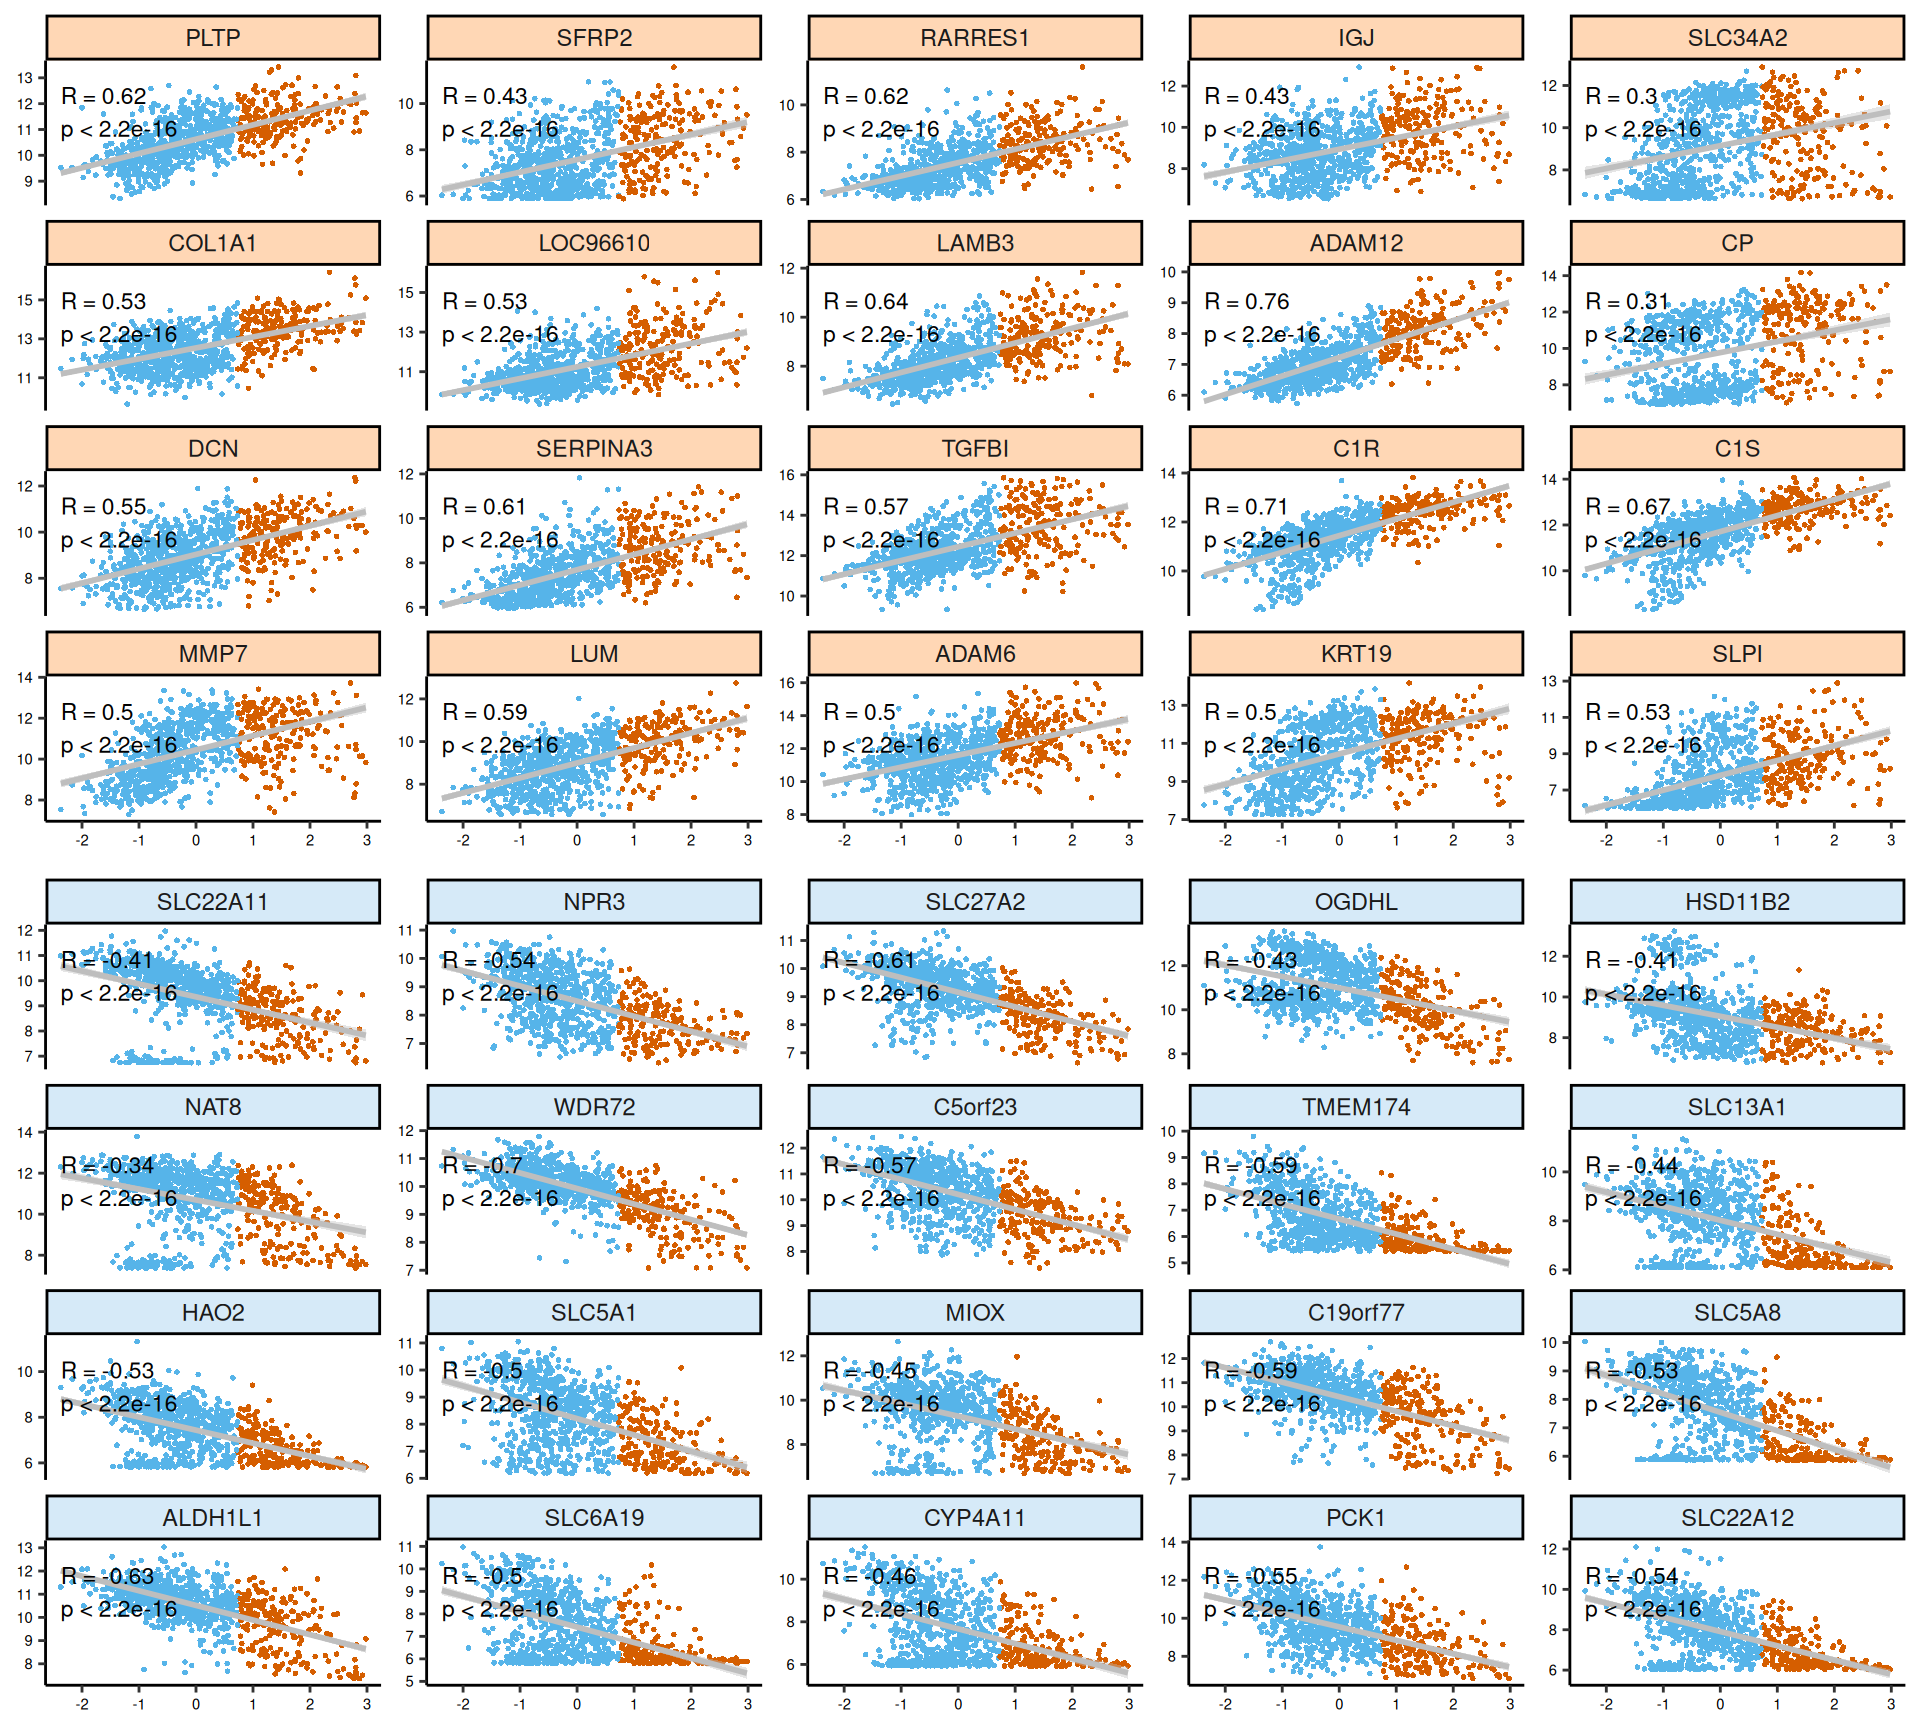
- Trancriptomics:
- Most of the positive and negative features are linear. In some we can see two different distributions of samples (e.g.: CP, NAT8, SLC22A11), that may reflect other factors of sample groupings that are not Factor 3. Indeed, these transcripts were among the top features discriminating KICH from KIRC and KIRP in Factor 2 (see Chapter 6).
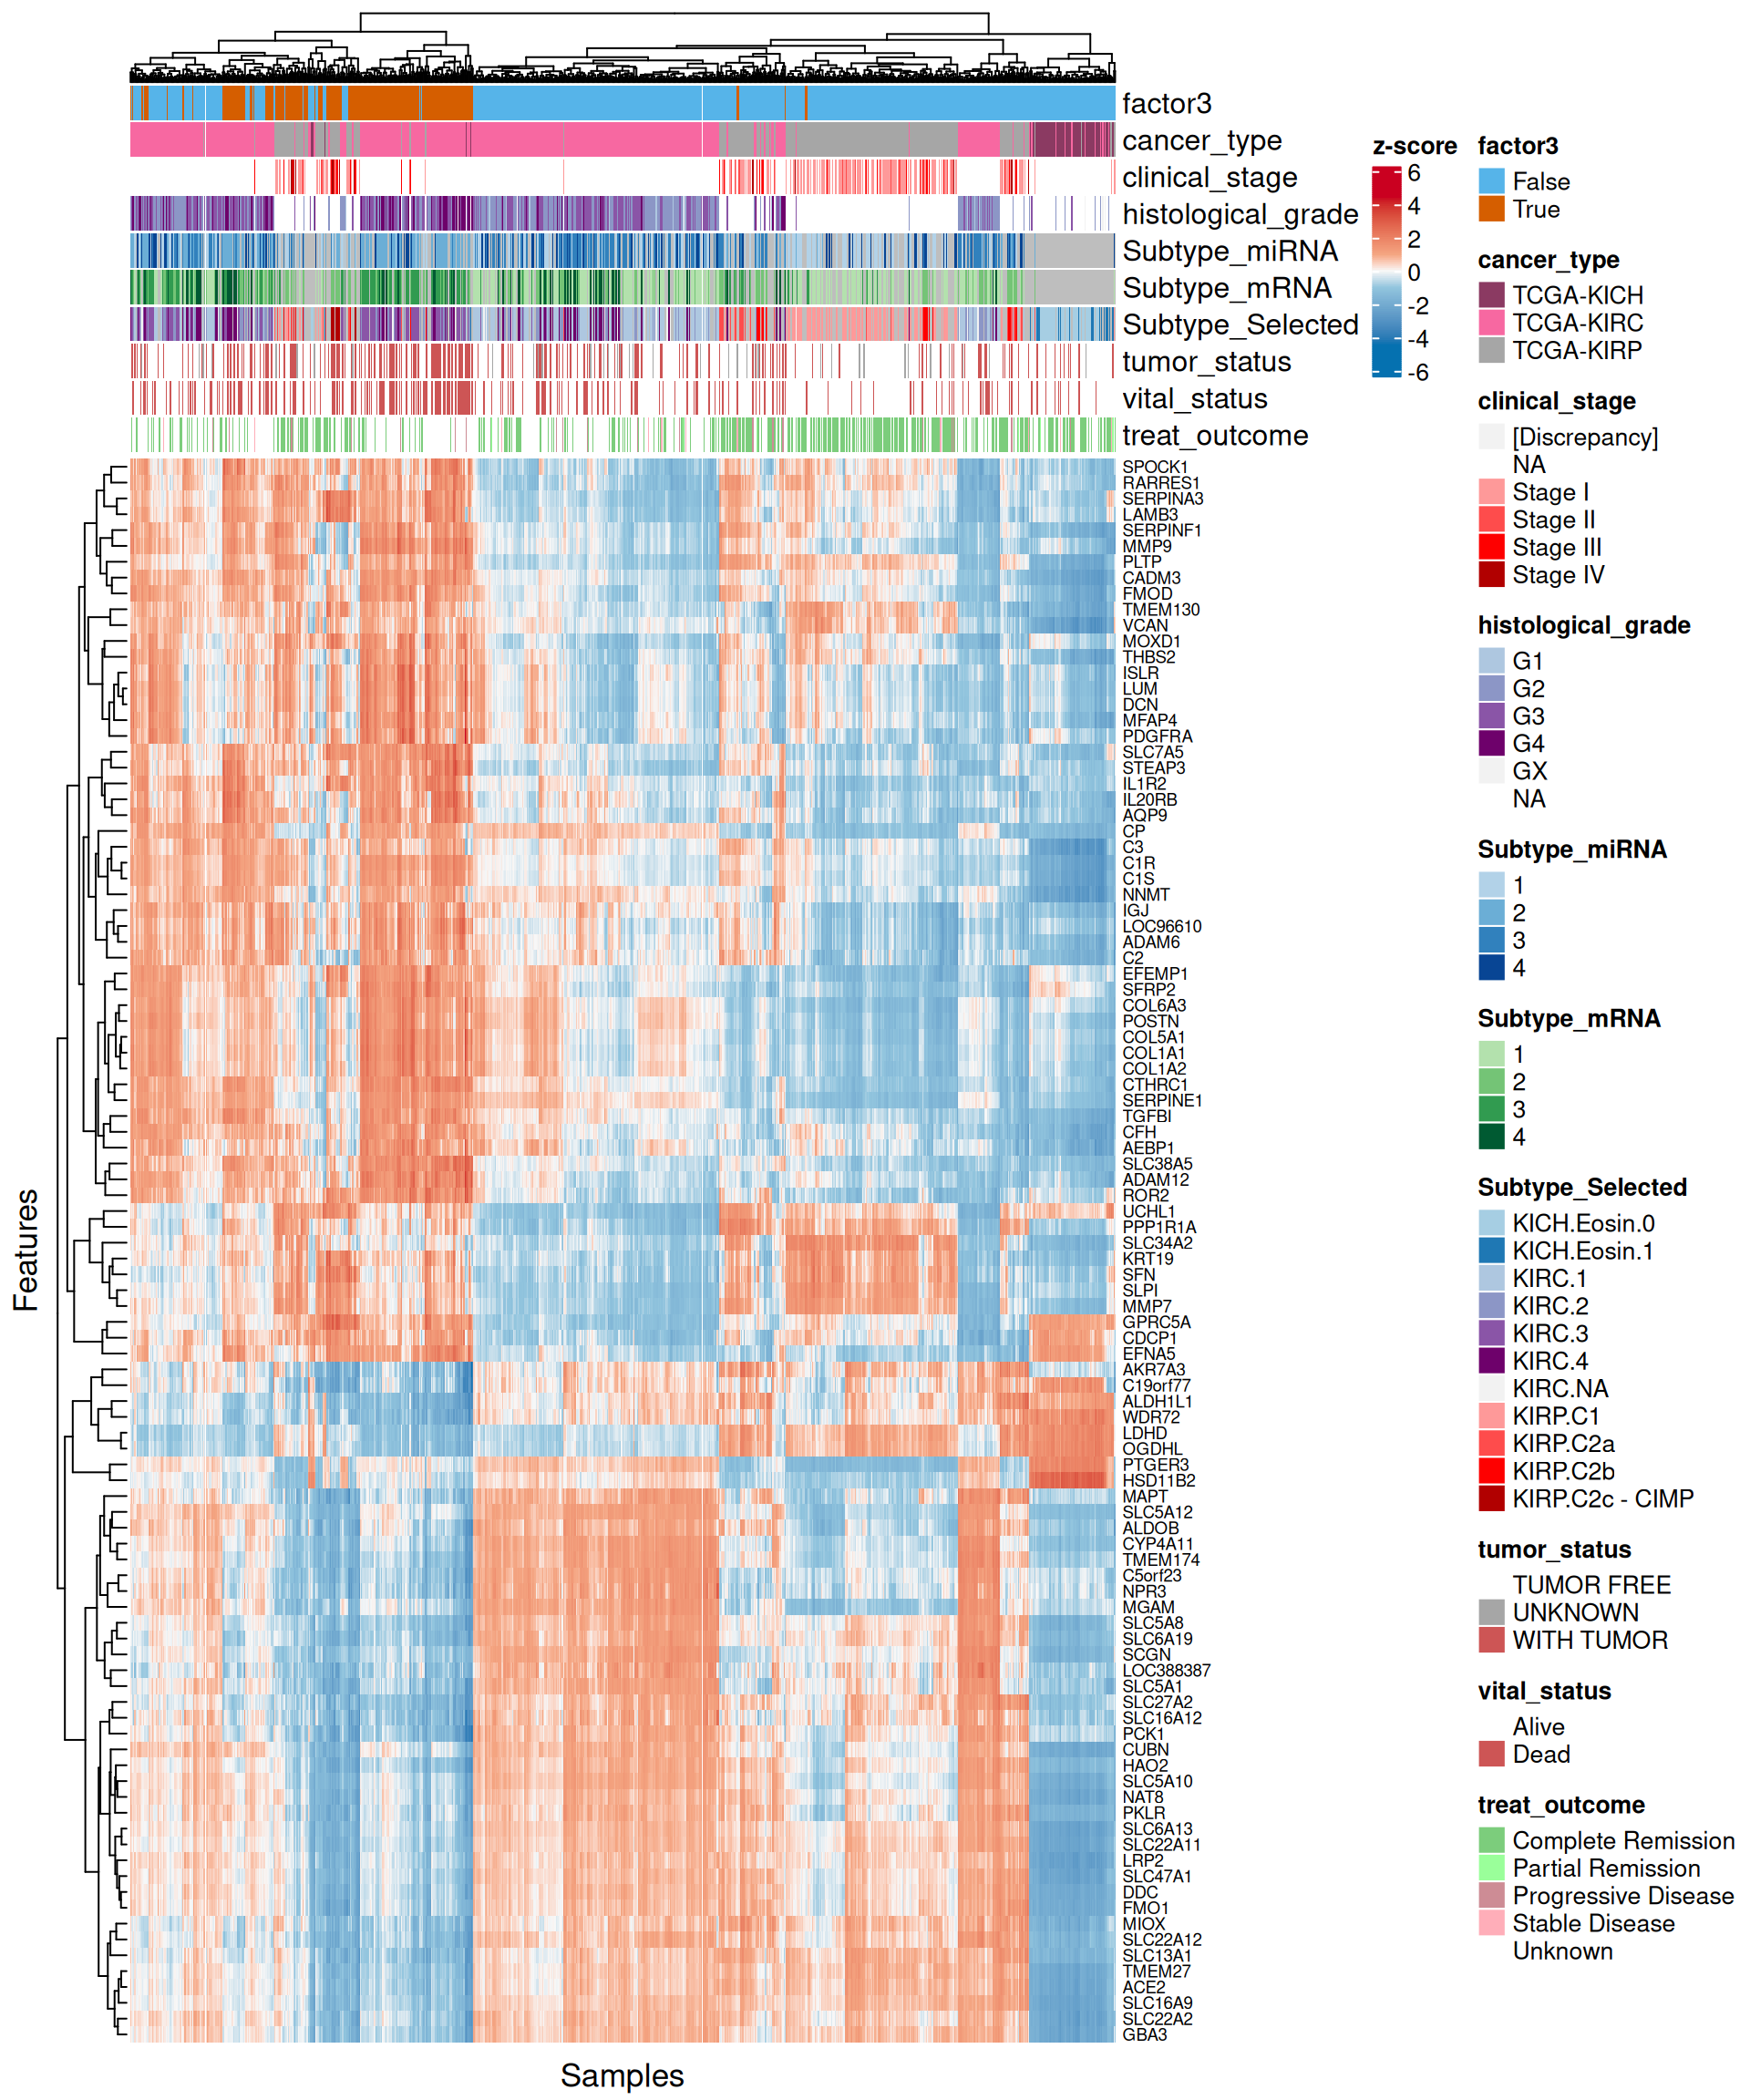
- Looking at the heatmap with the top 100 features with highest absolute weight, we can spot two major clusters, one with Factor 3 and part of other KIRC samples, and a second one with al the other patients. In the first cluster, Factor 3 and KIRC patients had a similar expression profile, and seemed enriched in cancers with higher cancer histological grade. Unfortunately, since cancer stage and histological grade information covariates are not available for all patients but are limited to KIRP and KIRC patients respectively, we cannot generalize this observation.
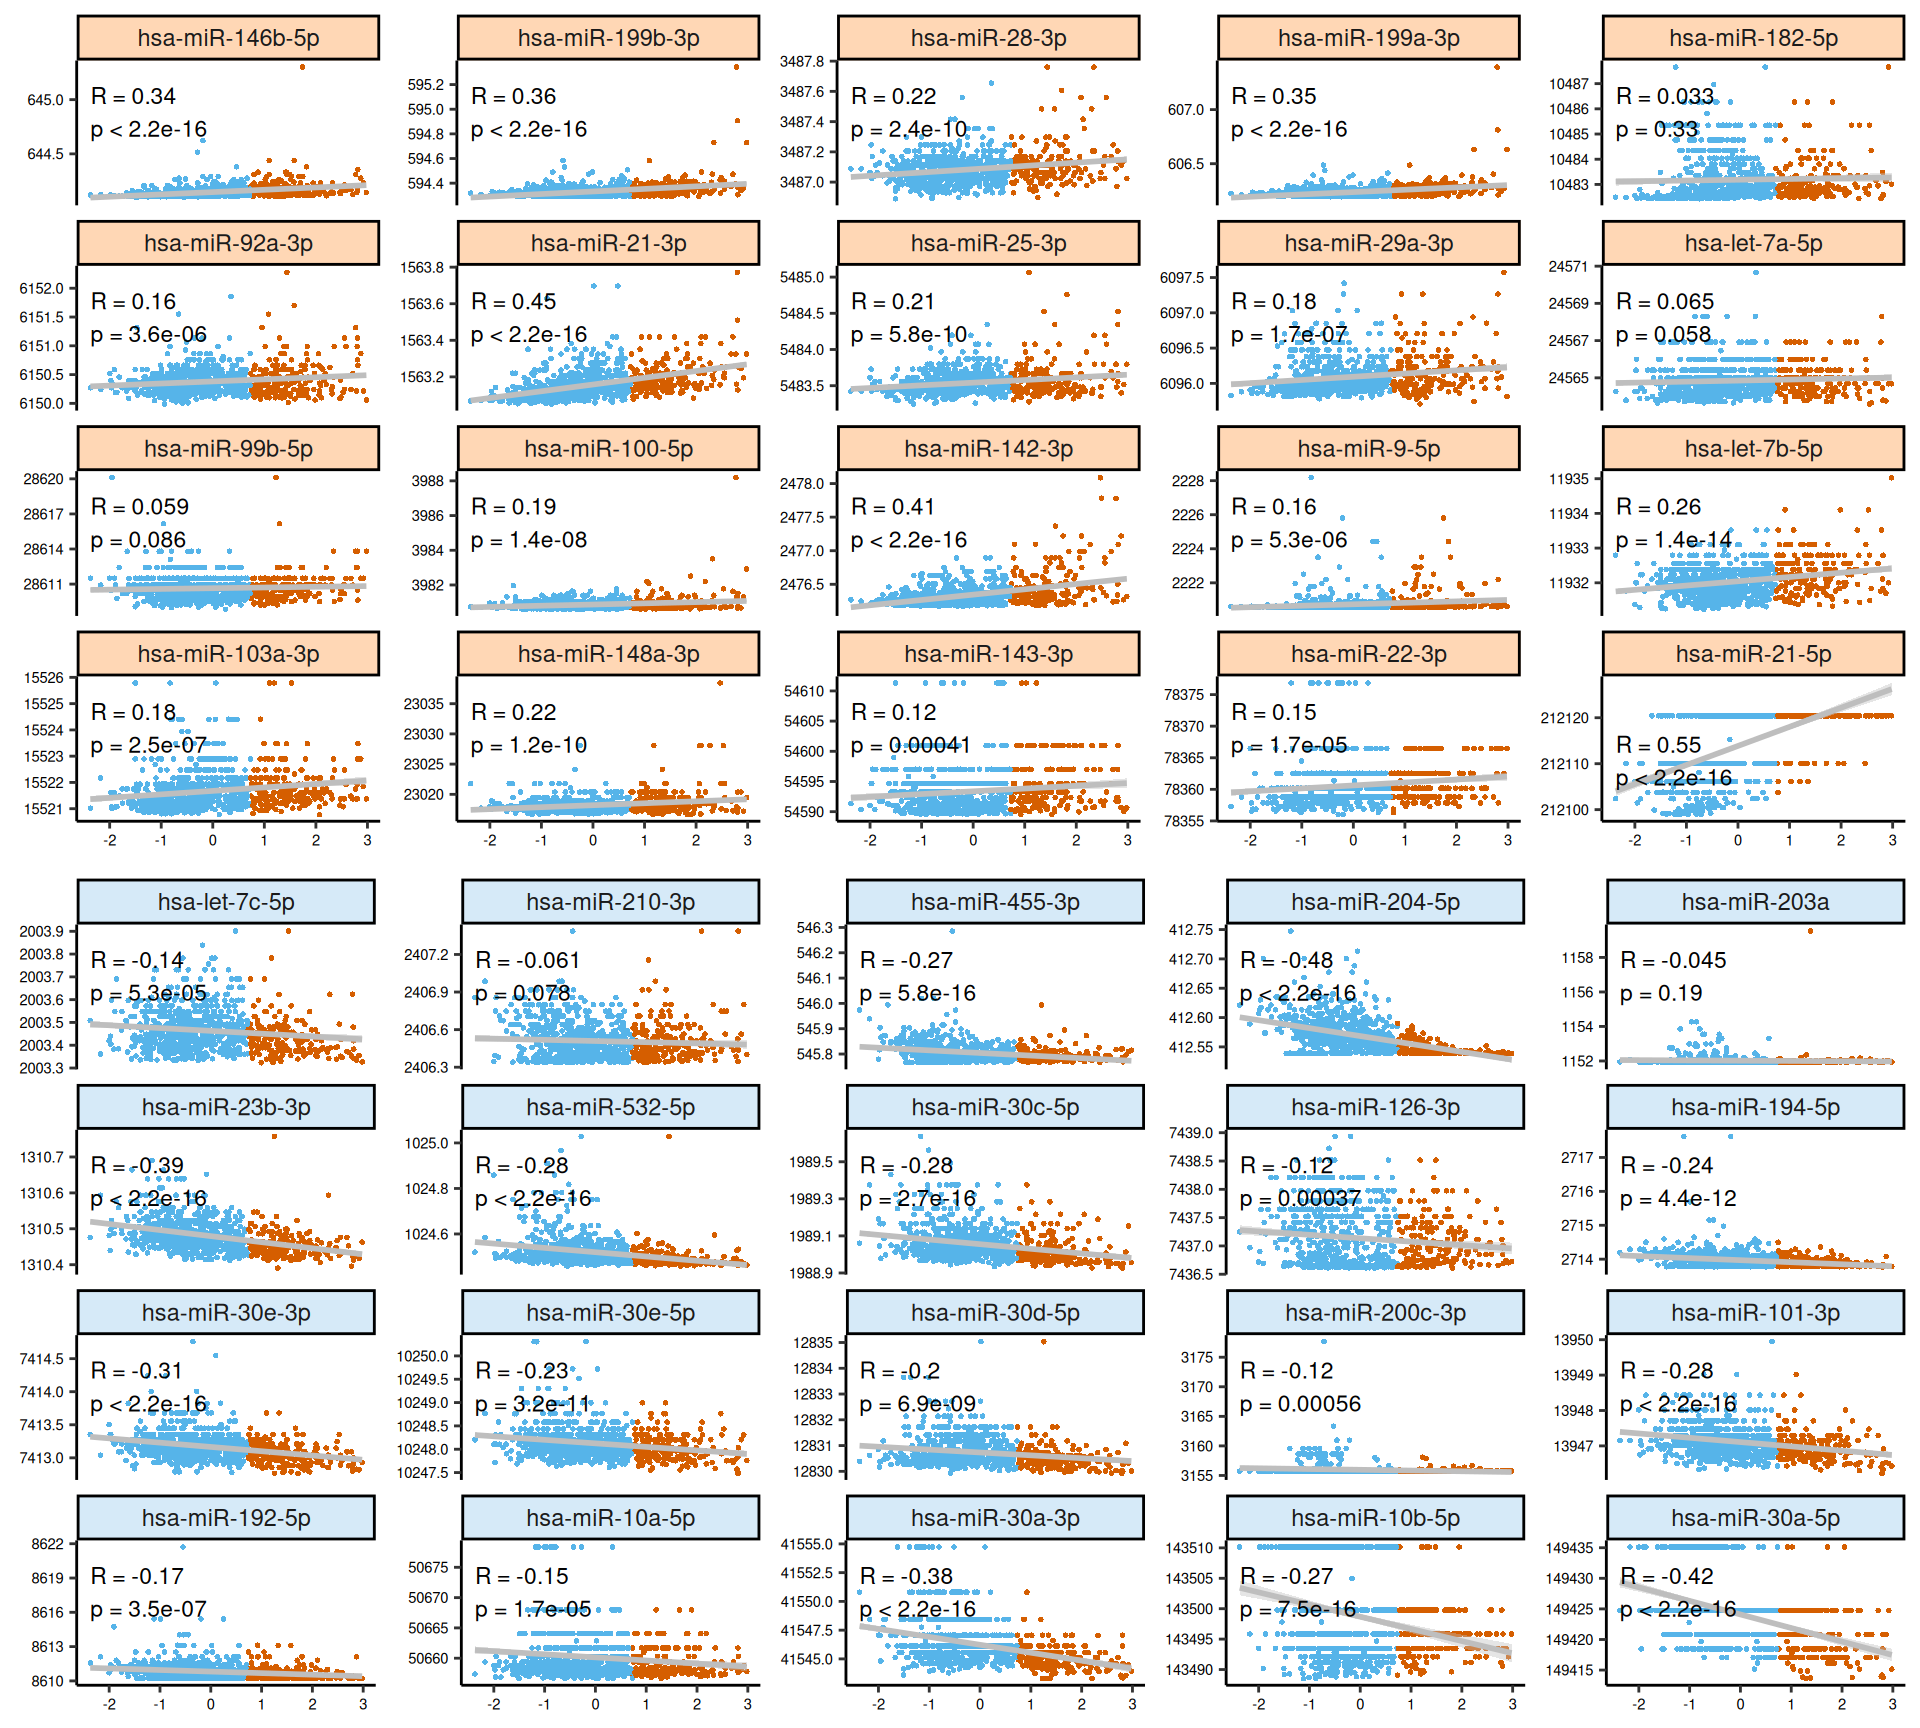
- micro-RNA:
- Both features with high positive and high negative weights seems to mostly have linear relationships with Factor 3. Some of the features scatterplots also show some linear artefacts, where the samples all sits at the same y-axis position.
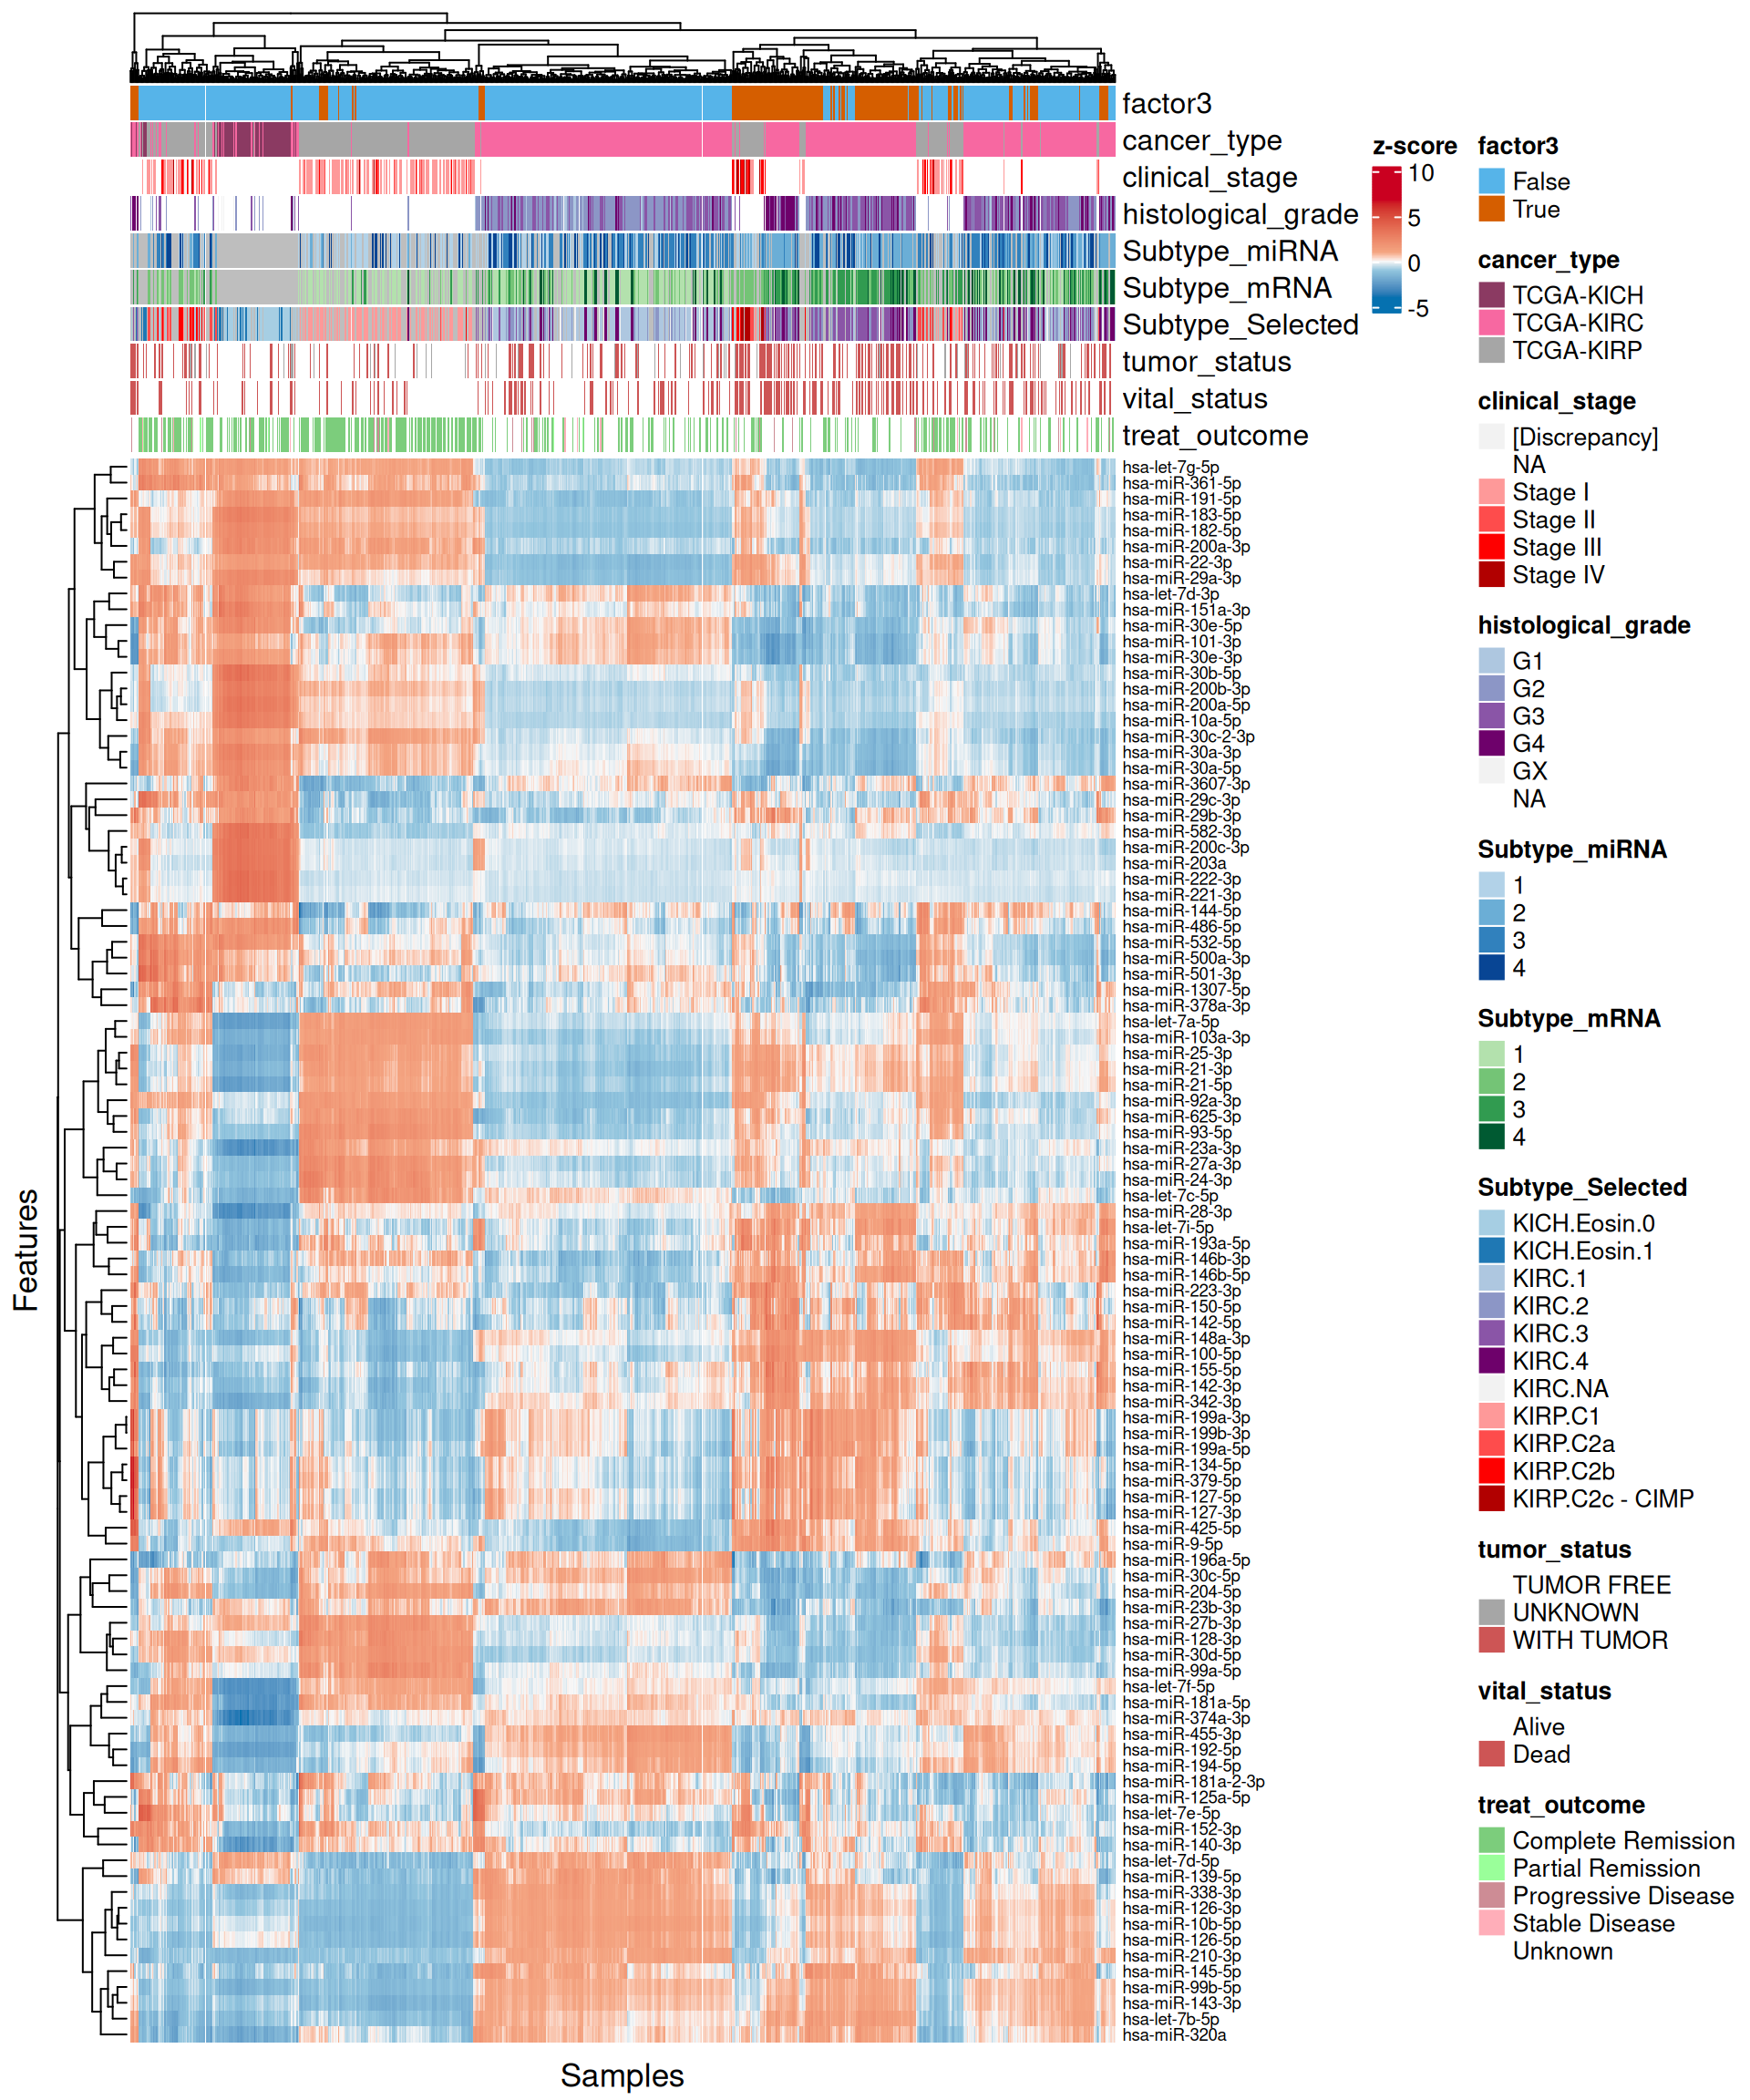
- Looking at the heatmap, we can identify two major clusters, similarly to what observed in the transcriptomics data. Once cluster contains most of Factor 3 samples and part of the KIRC biopsies with more advanced tumor stage and histological grade, the other cluster contains all the other samples. As a difference to what observed in the transcriptomics heatmap, the expression profiles between the two micro-RNAs clusters are not so clearly defined.
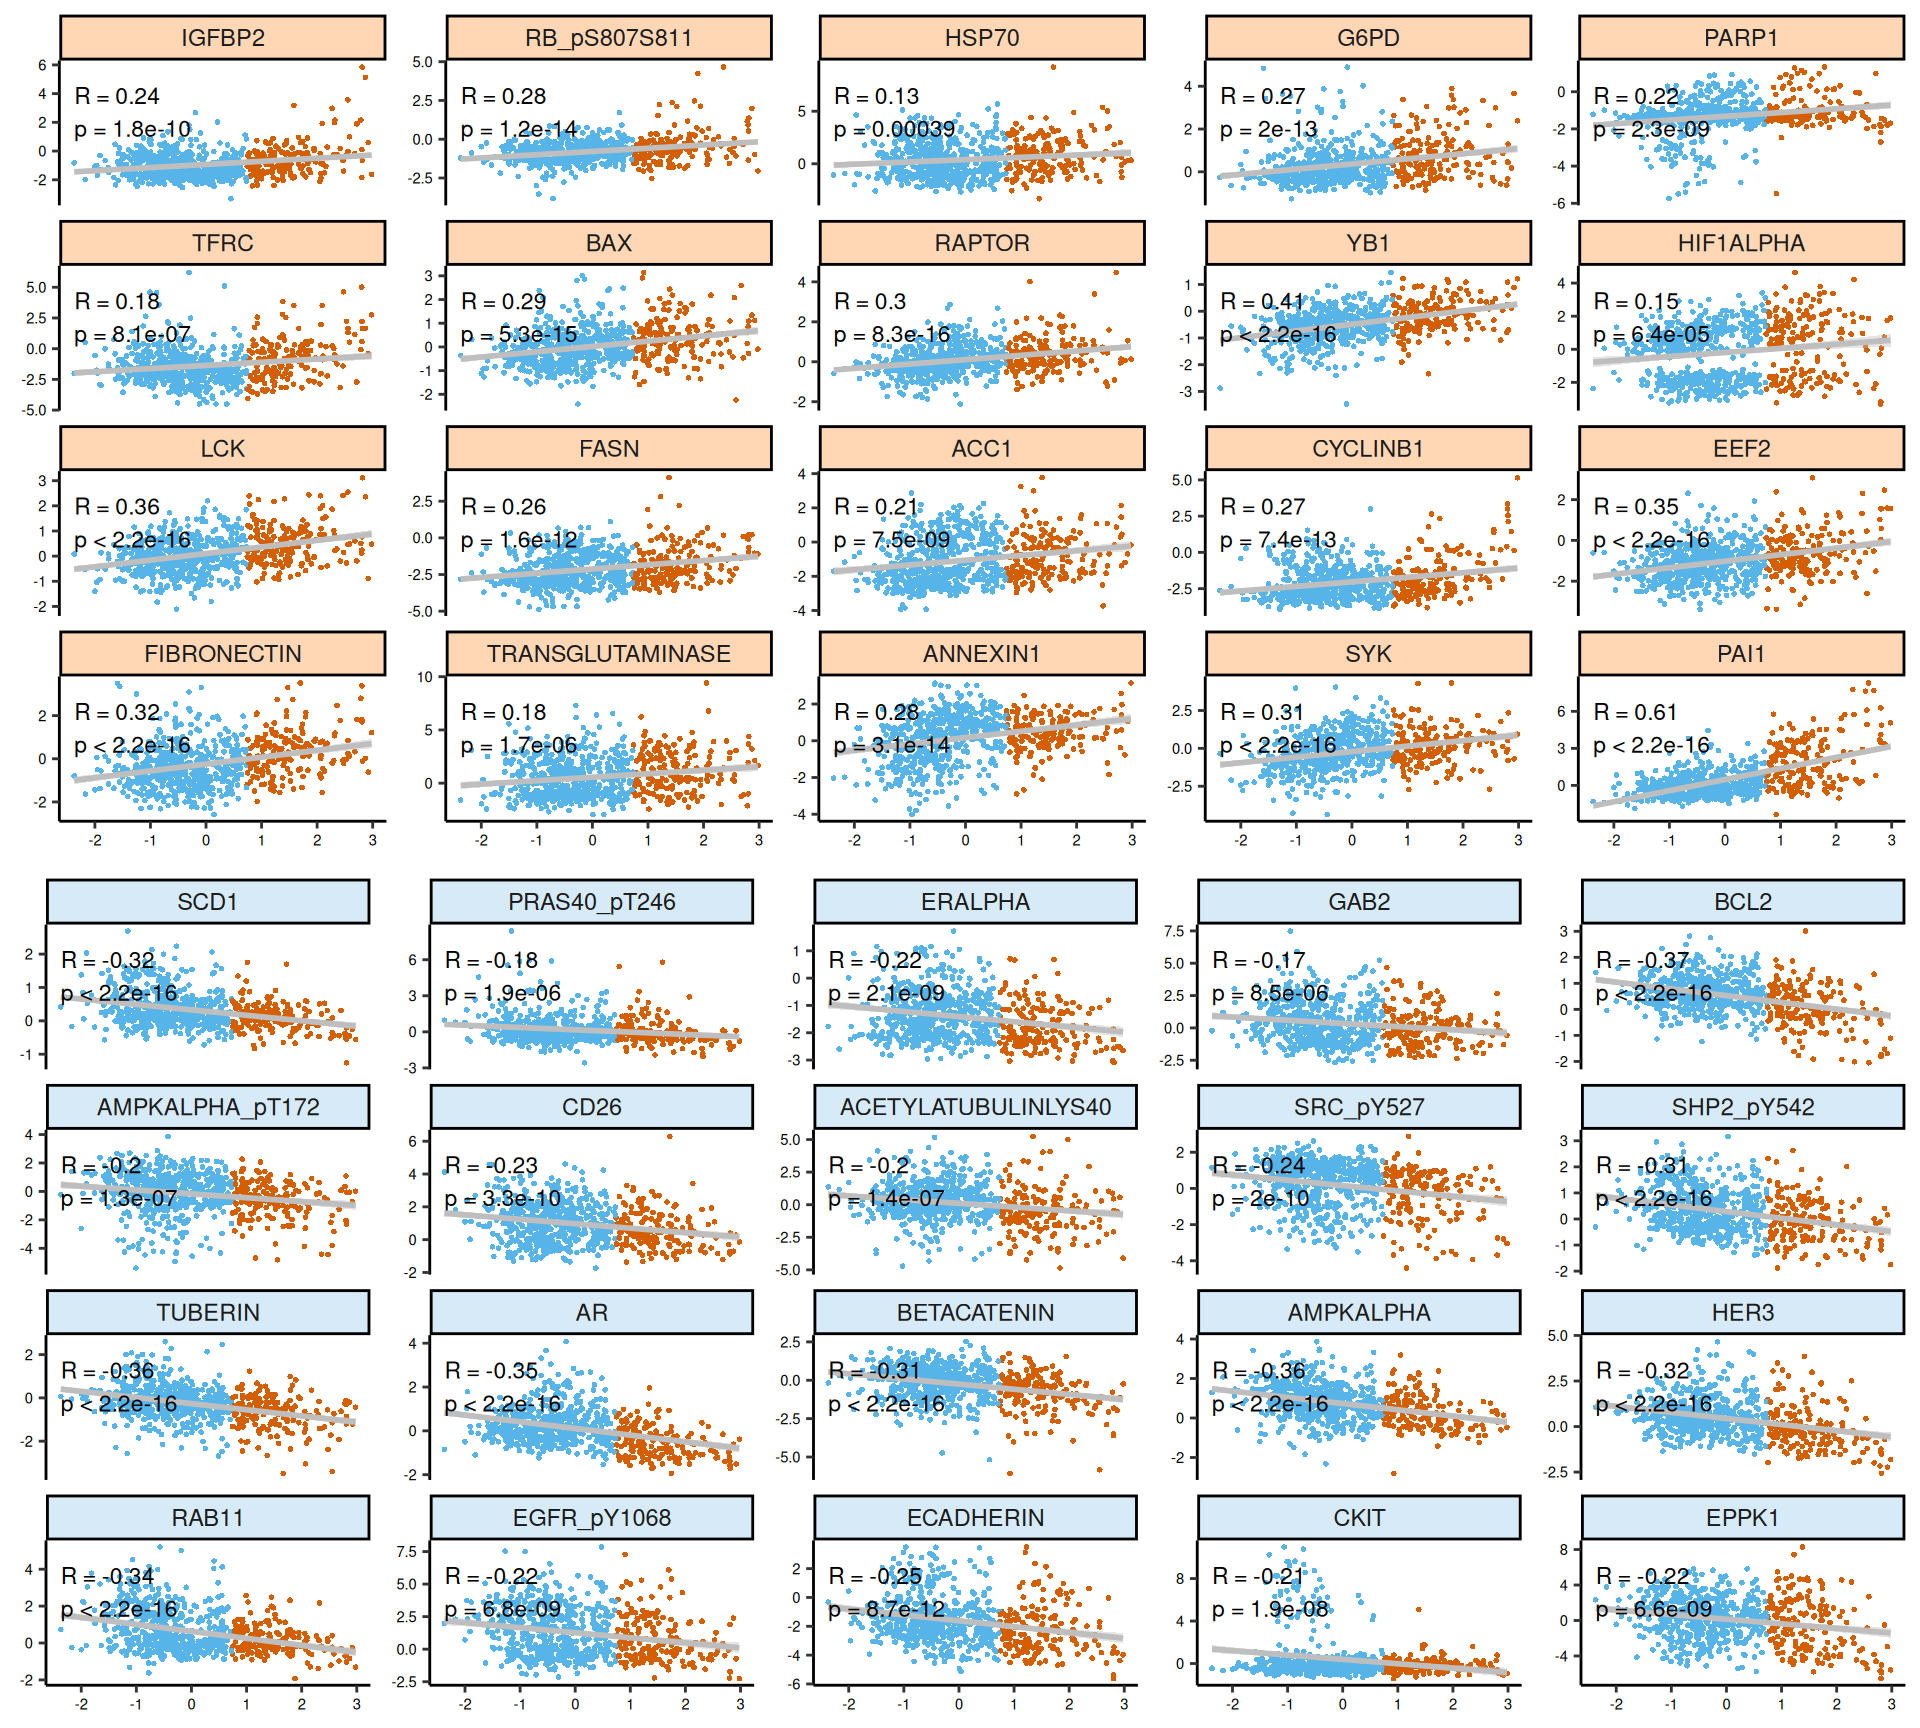
- Proteomics:
- Most of the proteomics features seems linear for Factor 3. We can observe as well two clusters of samples for HIF1ALPHA (associated with Factor 1: KIRC vs KIRP and KICH) and cKIT (associated with Factor 2: KICH vs KIRC and KIRP). The protein with positive weights most associated with Factor 3 was the Plasminogen activator inhibitor-1 PAI1 (R = 0.61): PAI1 is associated with worse outcome in different types of cancers. Instead, the proteins with negative weights most associated with Factor 3 are the AMP-activated protein kinase alpha AMPKα, the androgen receptor AR, apoptosis regulator BCL2, TUBERIN, with a negative correlation of R = -0.36, R = -0.35, R = -0.37, R = -0.36, respectively.
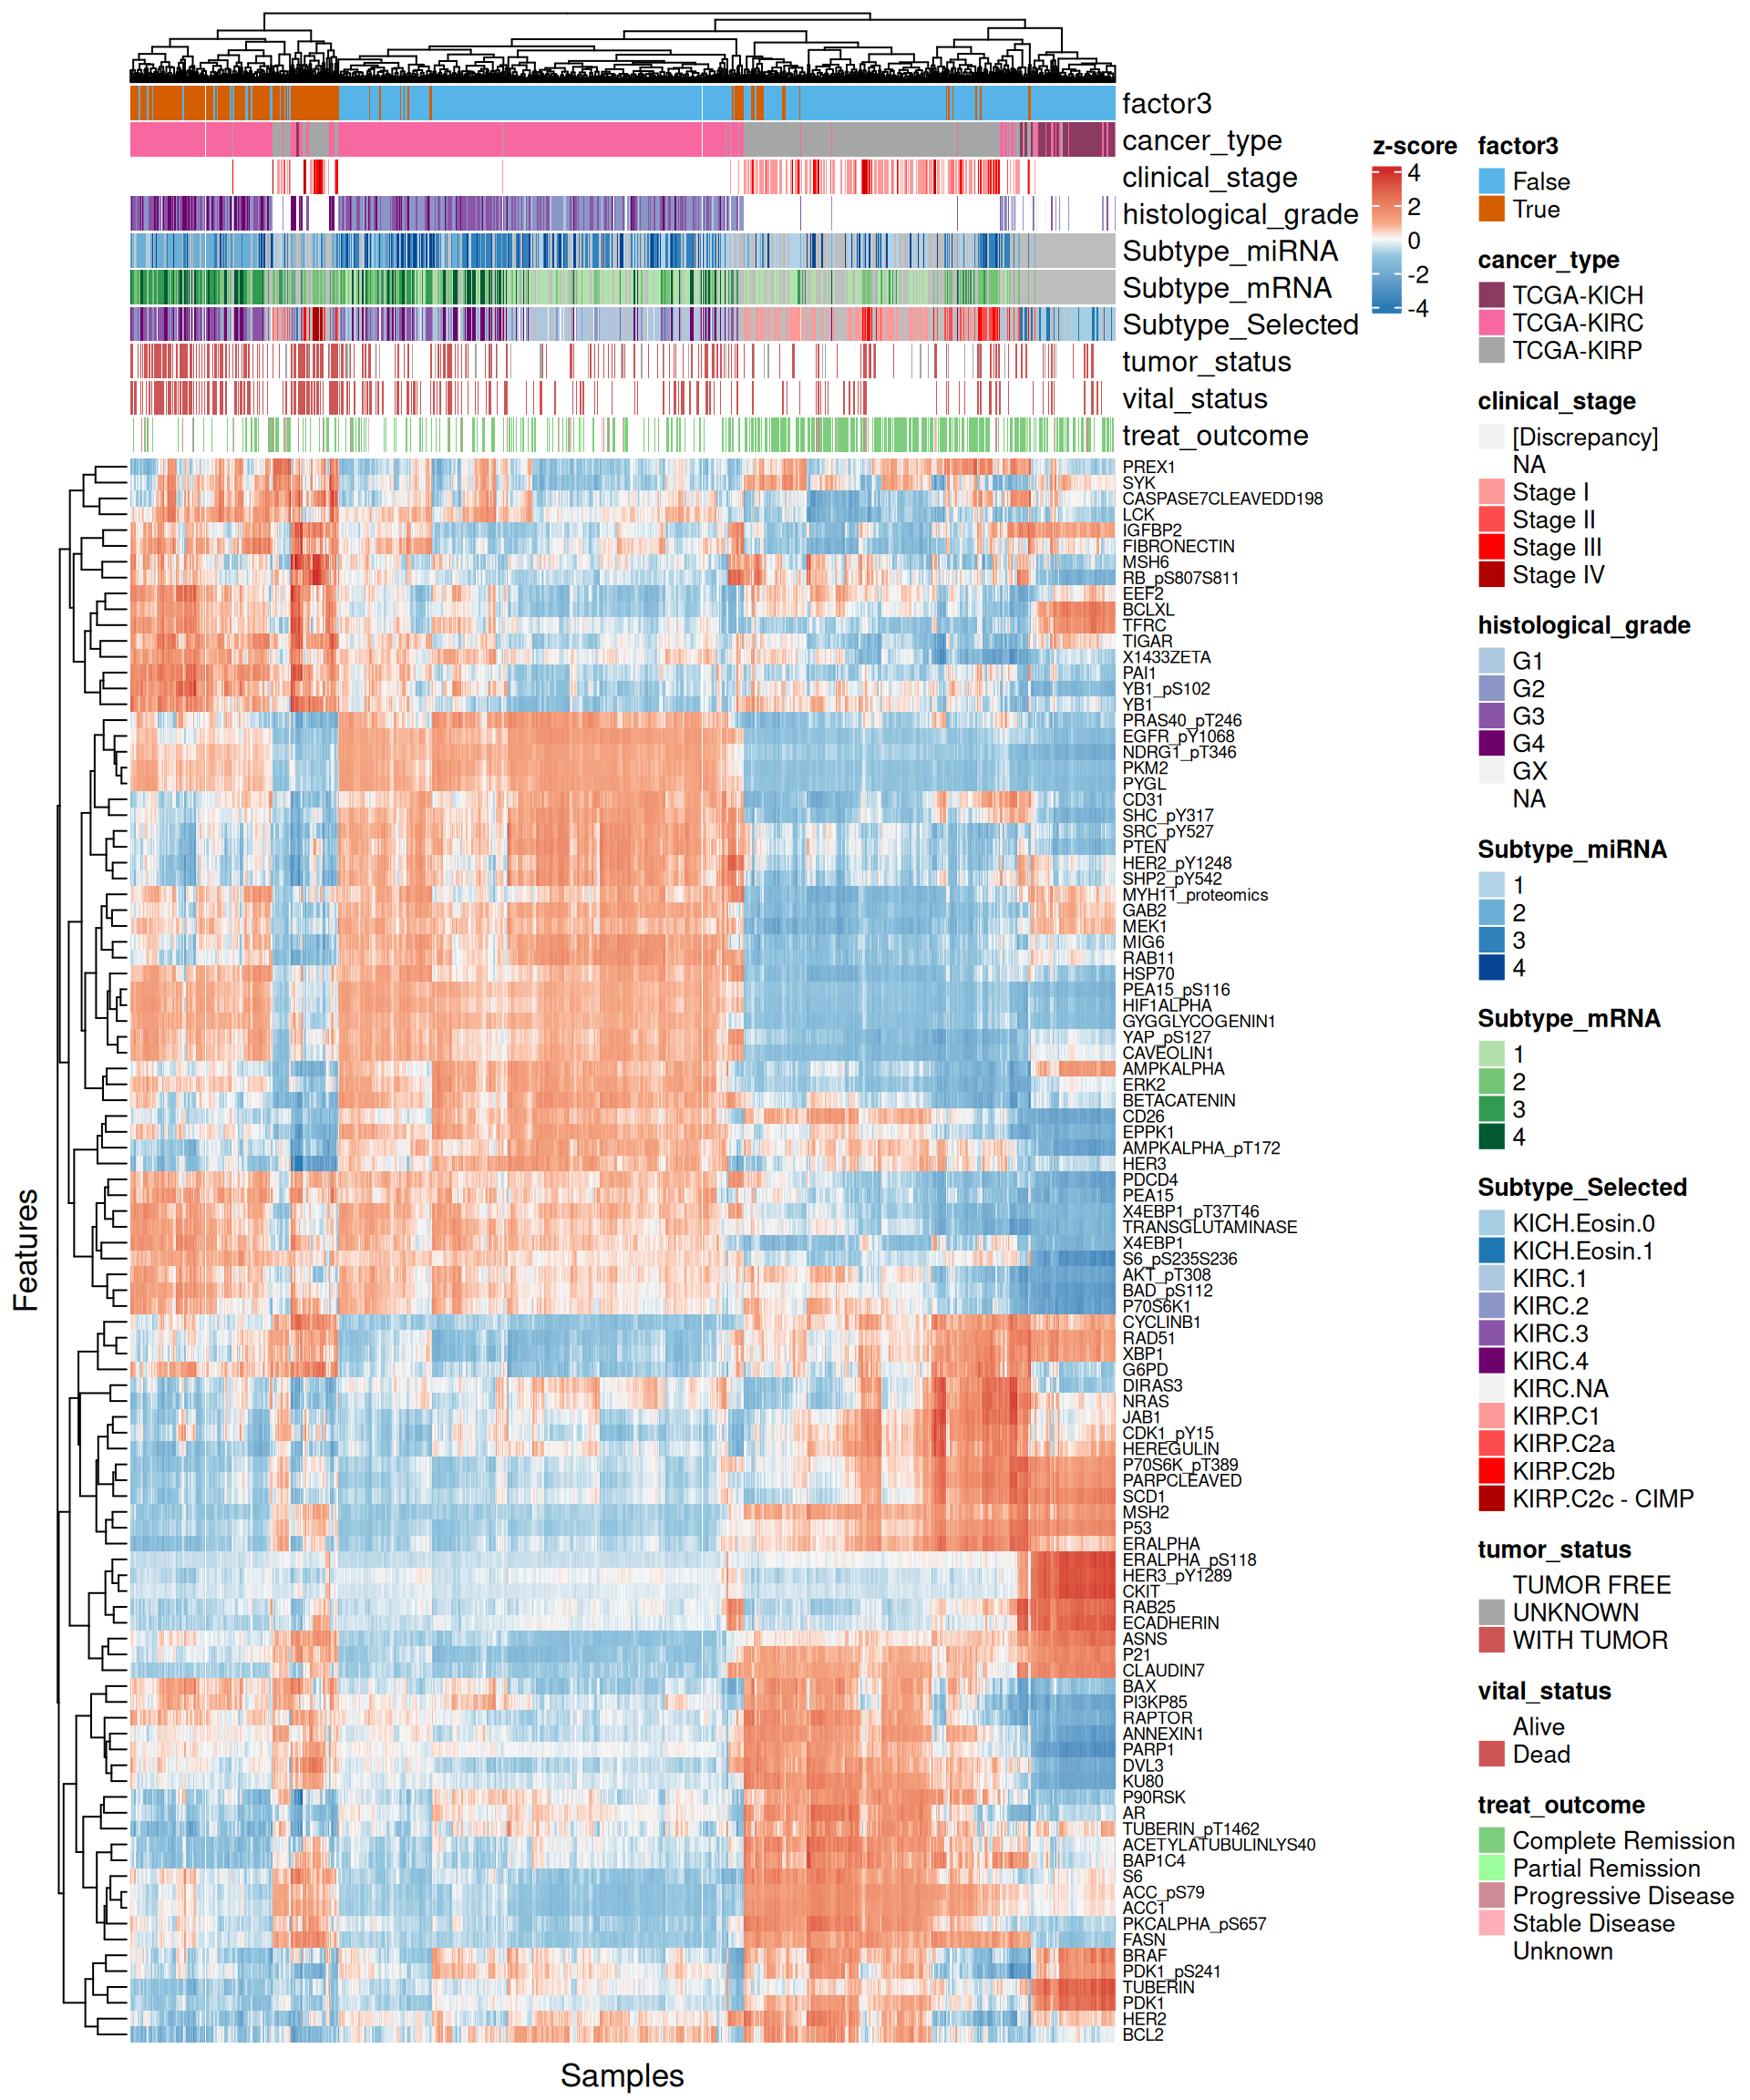
- The proteomics signature it clearly separates the kidney cancer types (KICH, KIRC and KIRP), in addition to discriminating between Factor 3 and all the other patients. There is a strong proteic signature for Factor 3 that includes 15 proteins: BCLXL, CASPASE7 cleaved, eukaryotic elongation factor 2 EEF2, FIBRONECTIN, IGF-binding protein 2 IGFBP2, proto-oncogene LCK, MSH6, PAI1, PREX1, SYK1, retinoblastoma transcriptional corepressor 1 RB phosphorialted, Transferrin Receptor TFRC, TP53 induced glycolysis regulatory phosphatase TIGAR, Y-Box Binding Protein 1 YB1 and YB1 phosphorilated (a known kidney prognostic biomarker), and 14-3-3 protein zeta/delta X1433ZETA.
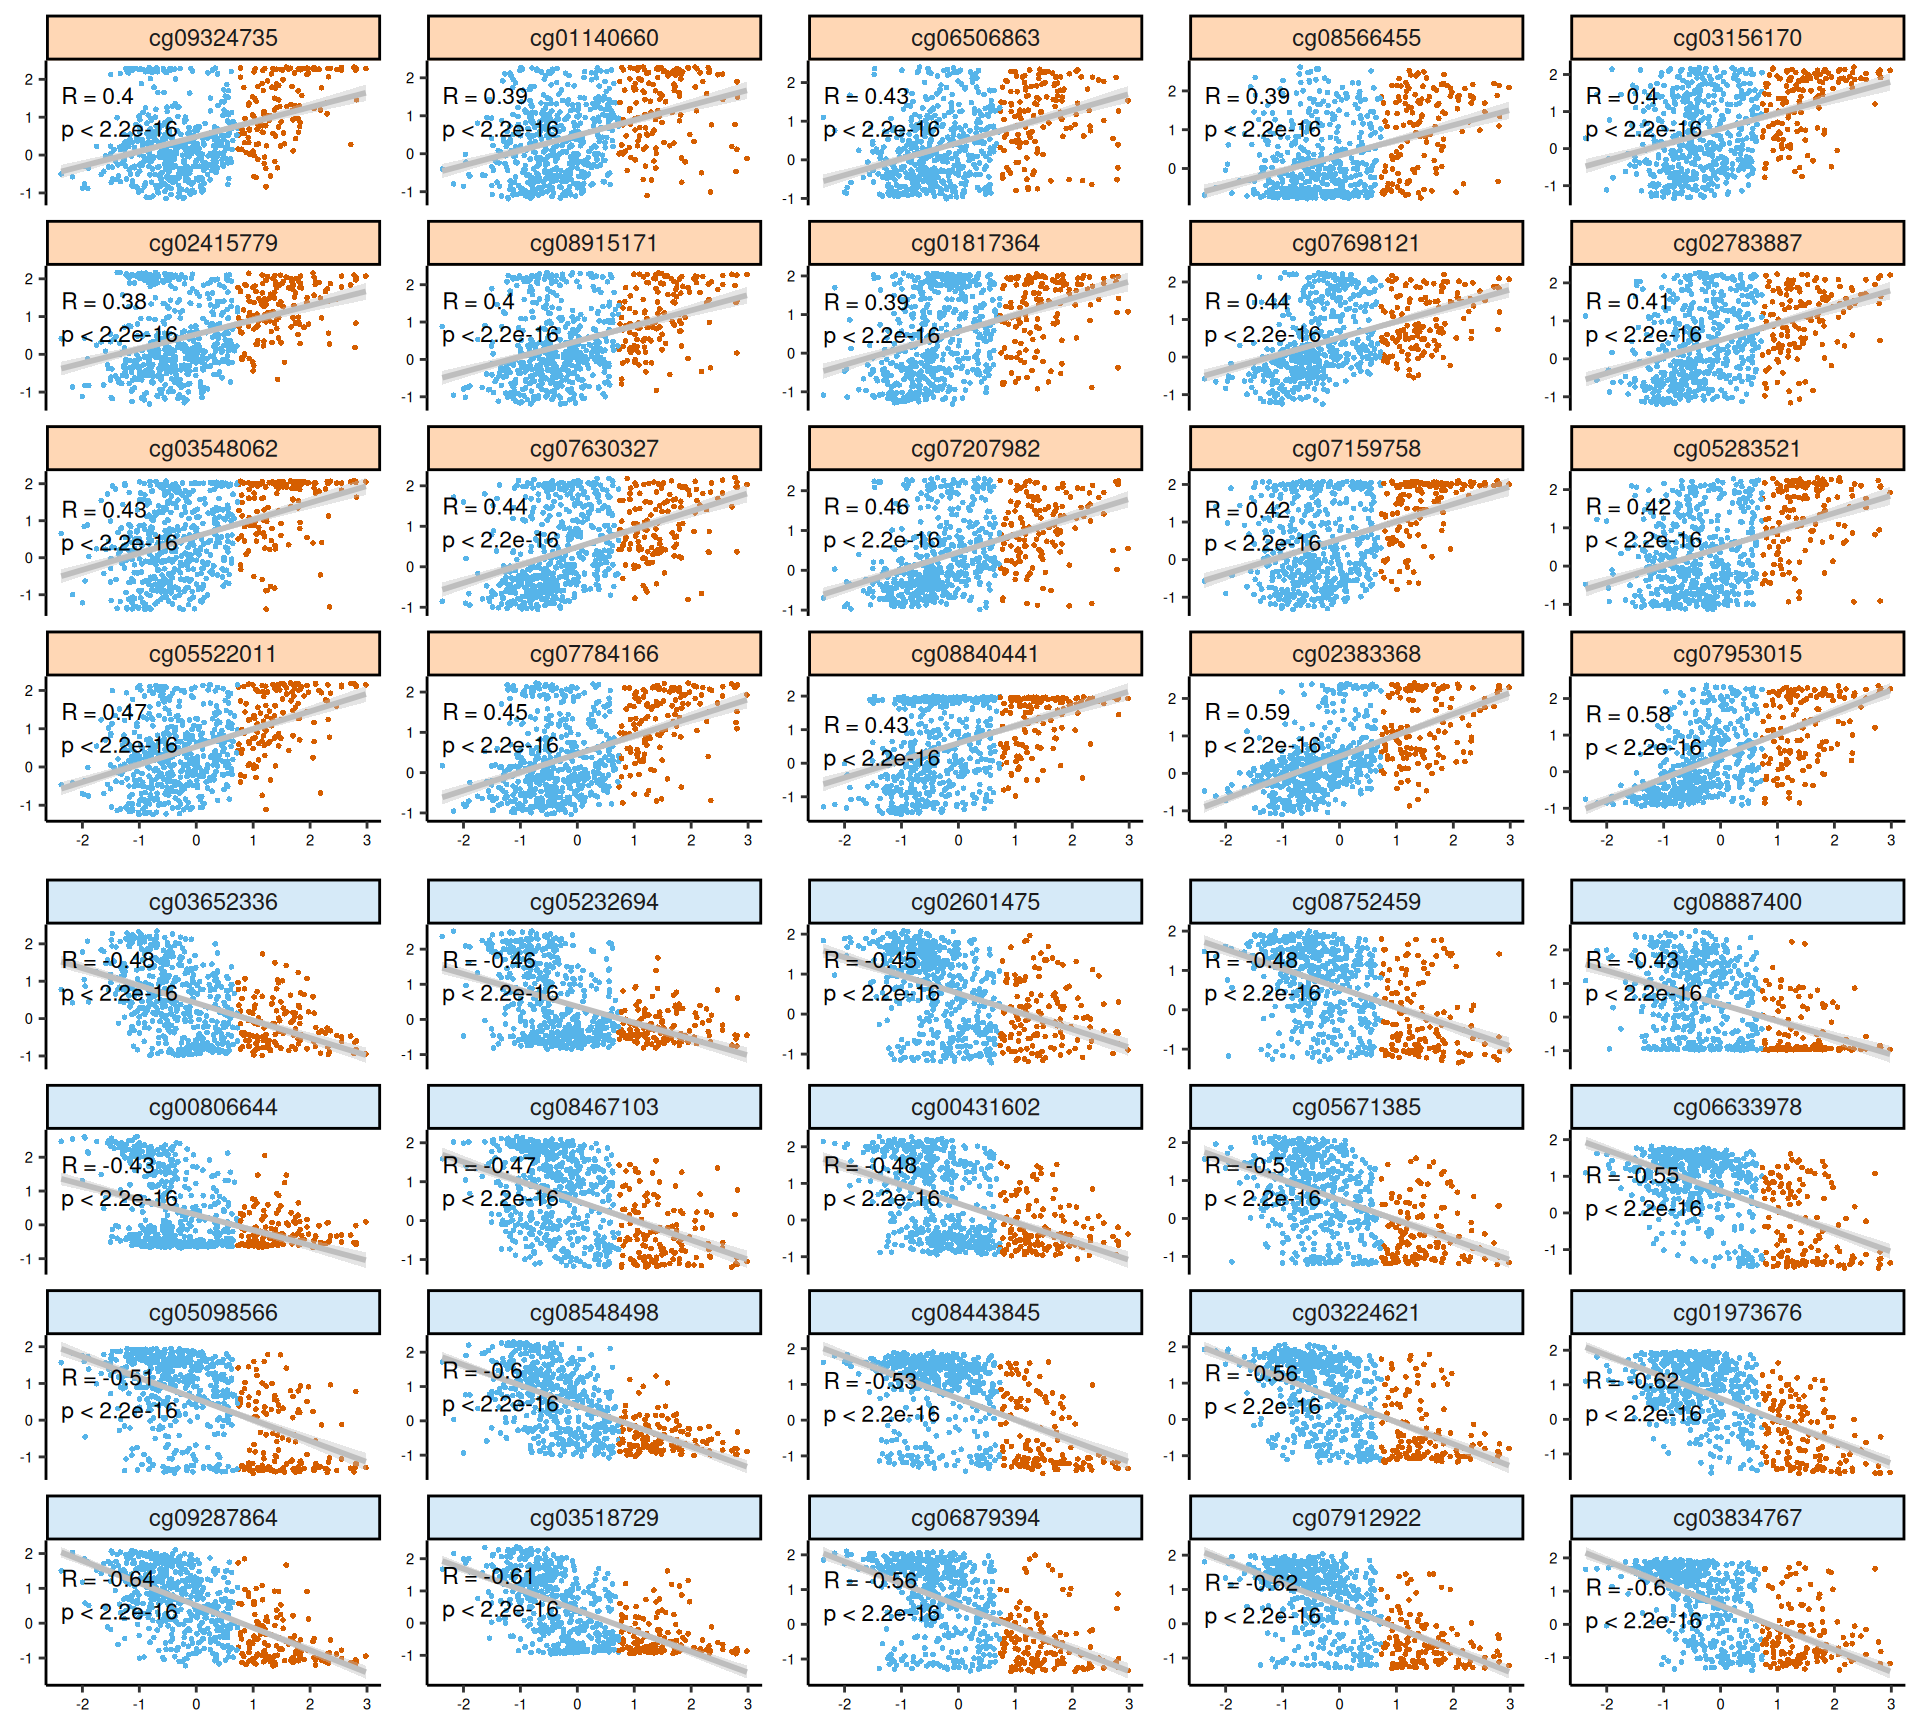
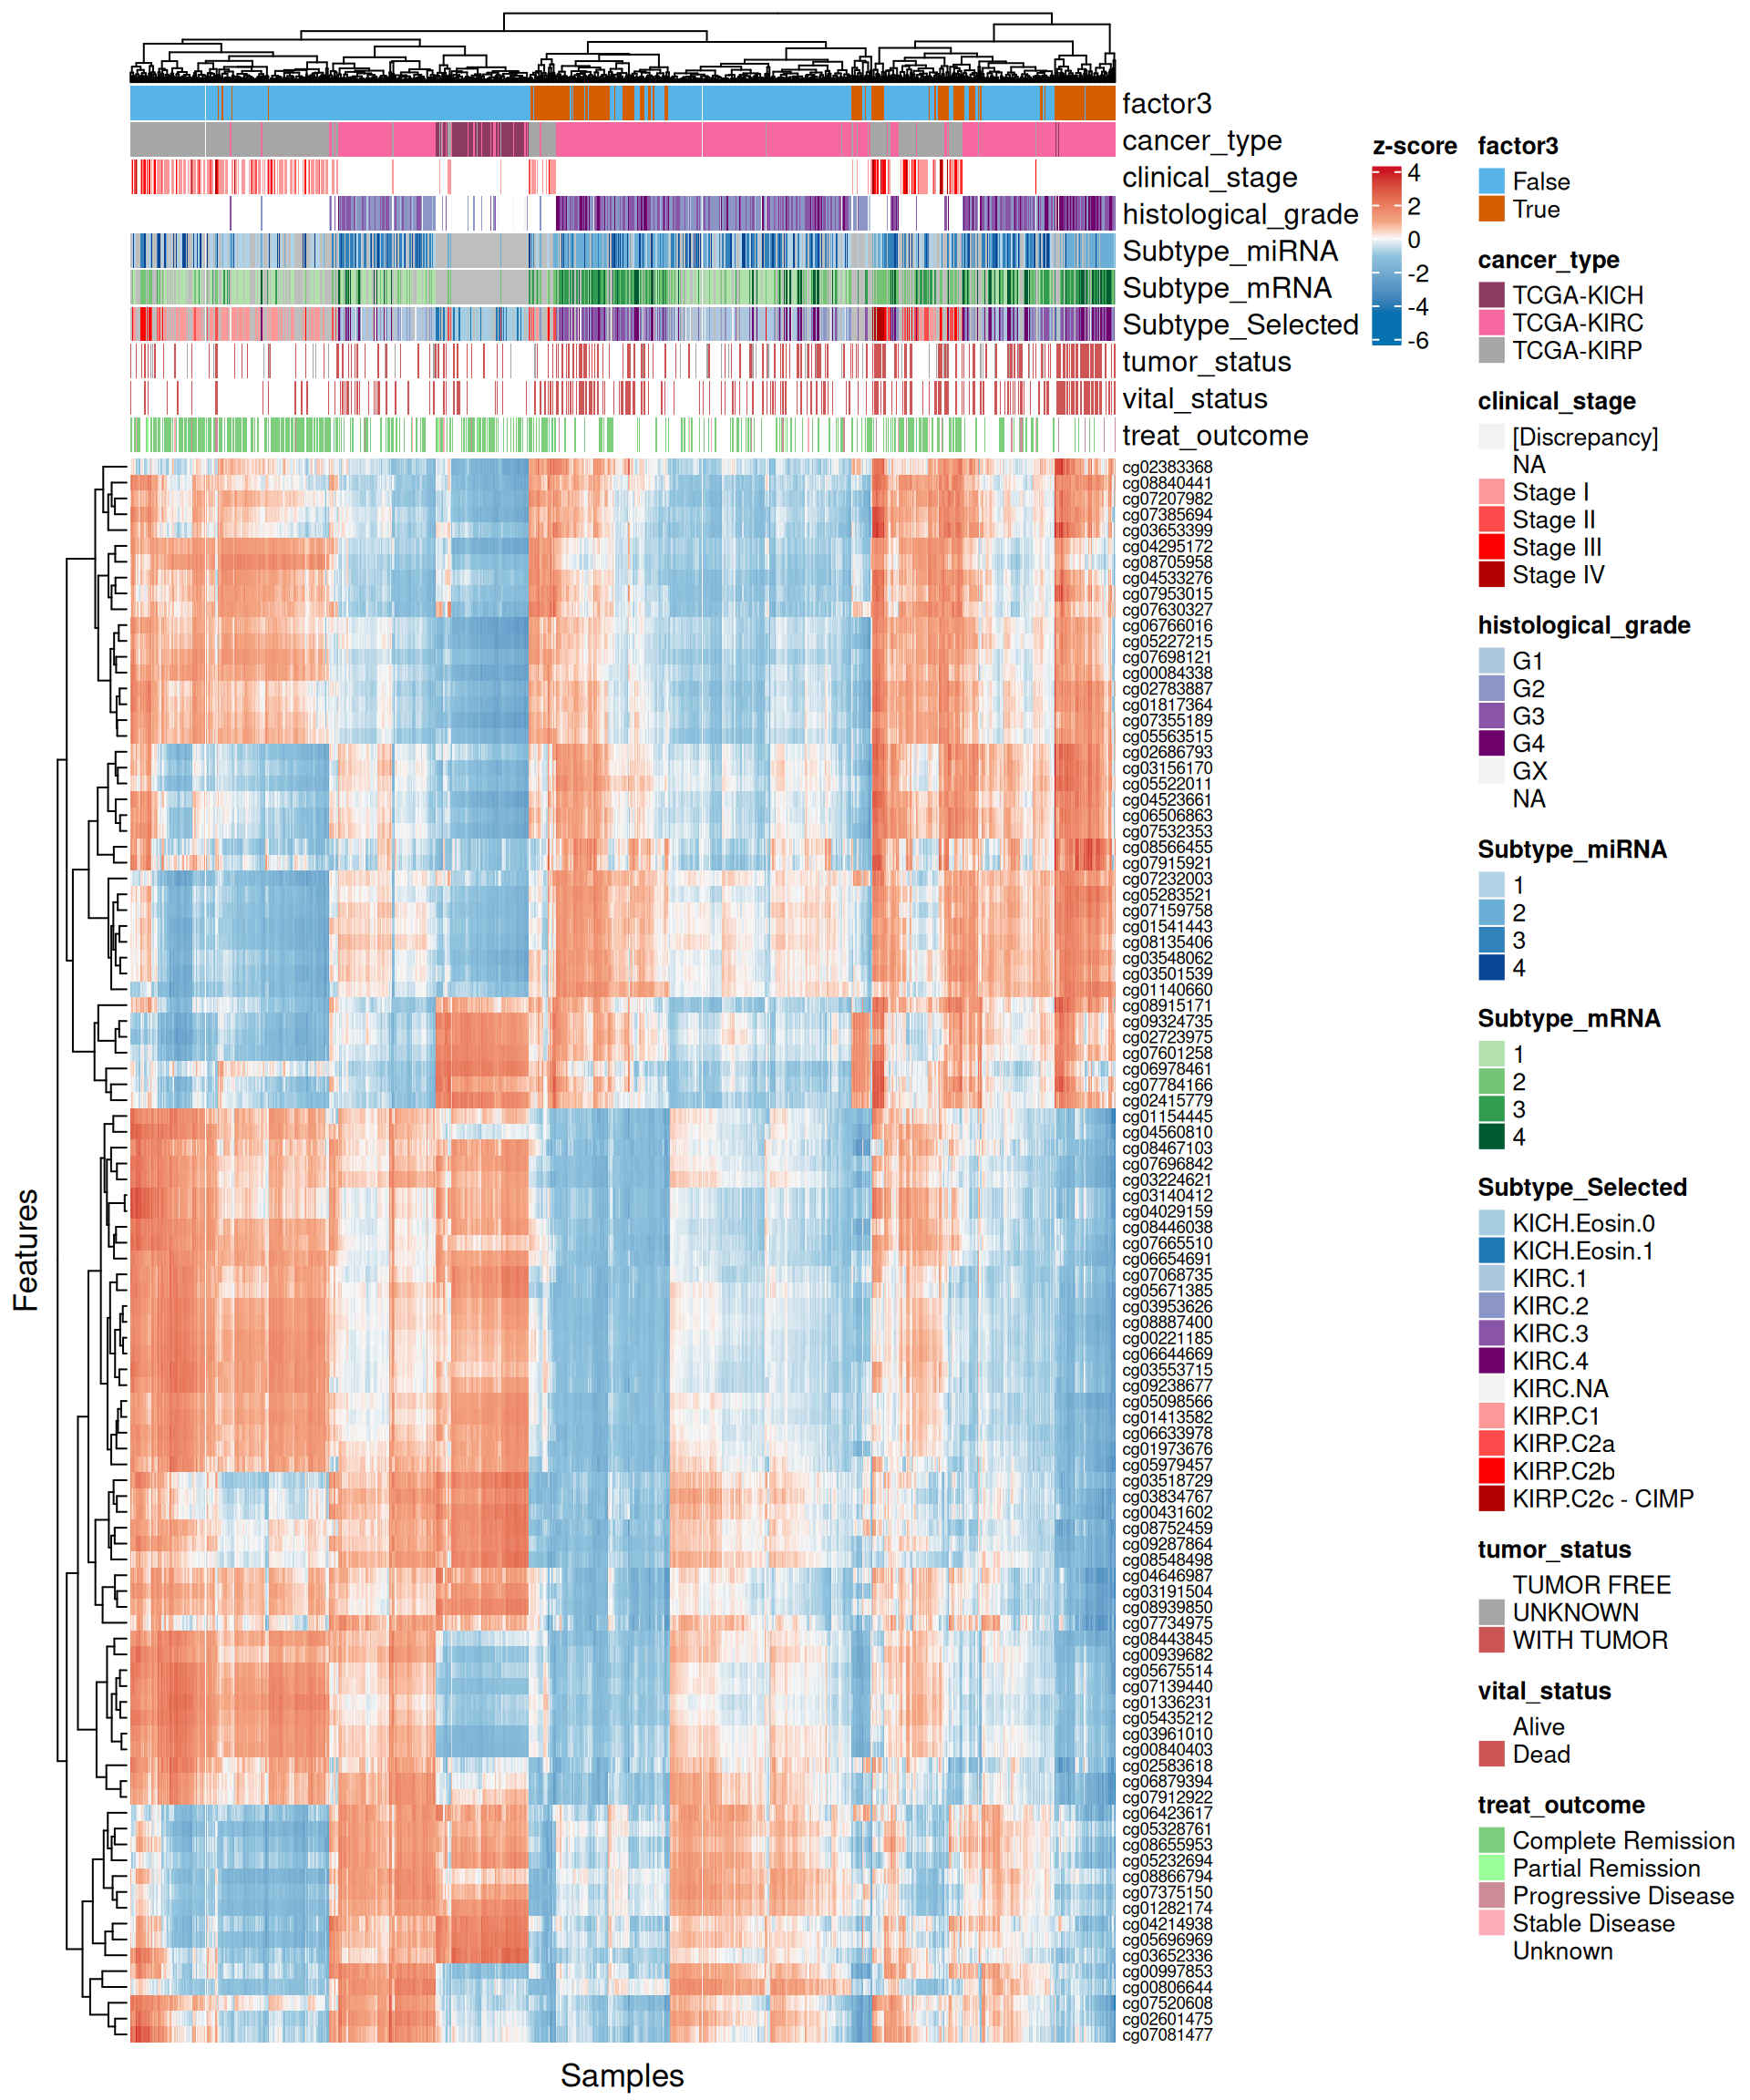
- Epigenomics:
- The scatterplots of the features with highest absolute weights suggested that there is poor to no linearity on most of the top features.
- Looking at the heatmap, we can observe a lack of clear clustering of Factor 3 patients, and patients were rather clustered based on their kidney carcinoma type (KICH, KIRC or KIRP). Probes associated with Factor 3 showed anyway a somewhat conserved pattern.
8.3.1 Multi-omics interaction network
In the next step, we retrieve the most important features in Factor 3 for each omics layer and we look manually curated databases for gene-gene interaction in order to refine the molecular signature we are building for Factor 3.
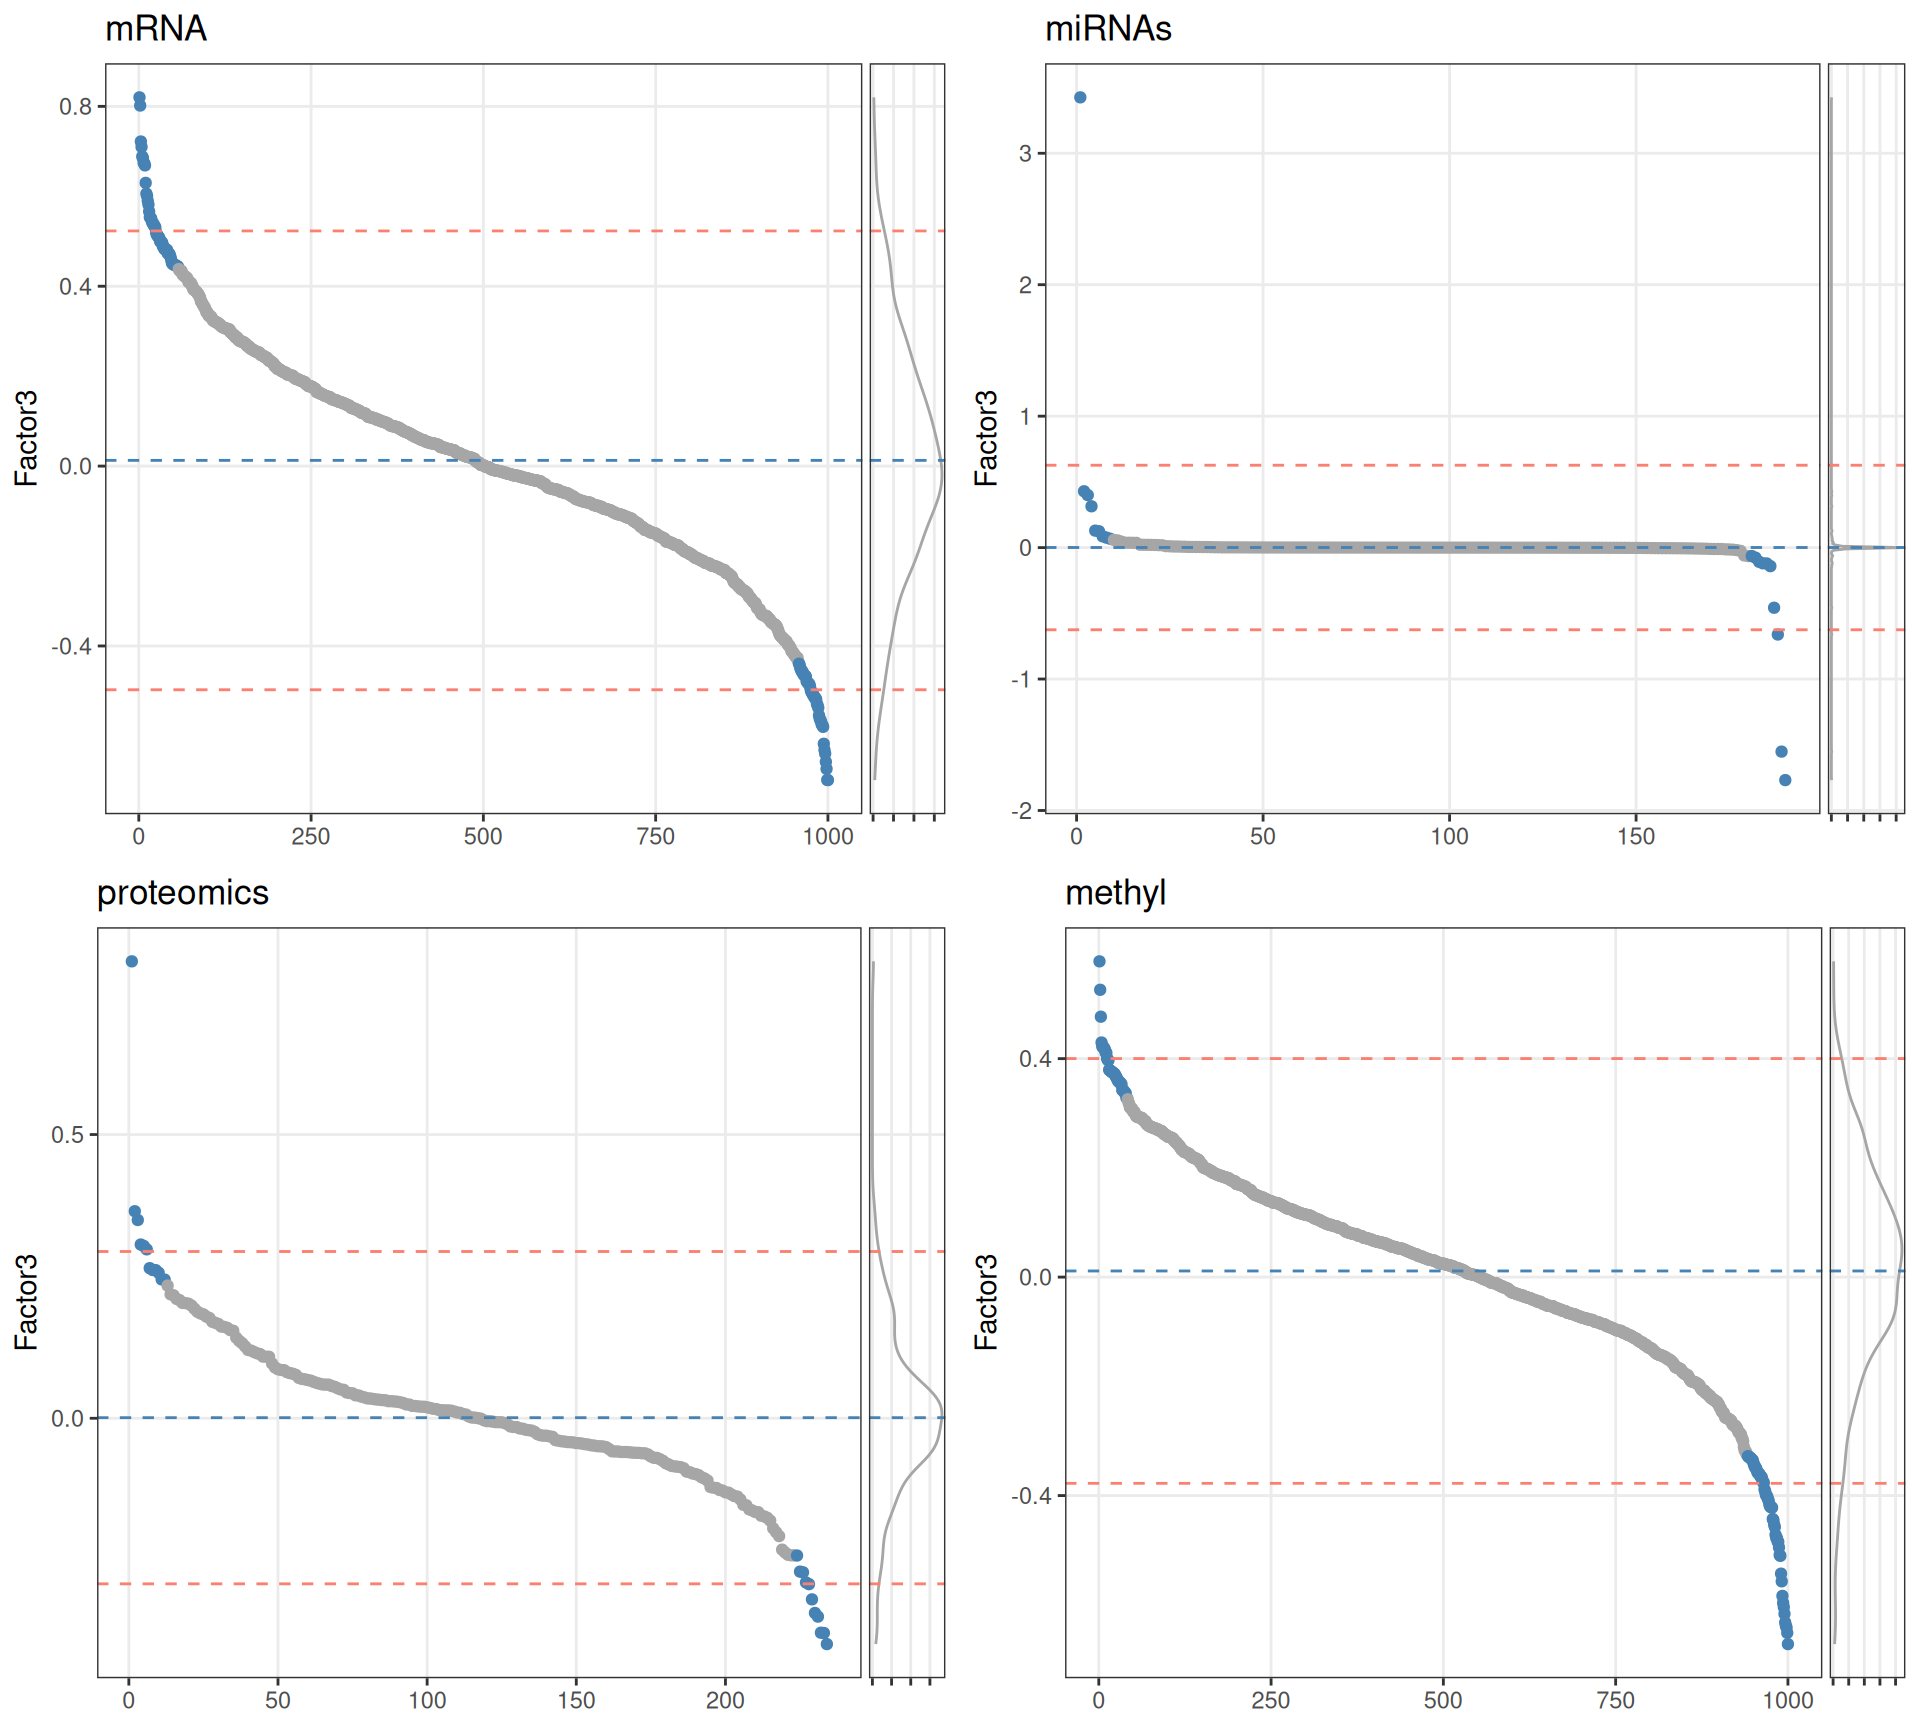
Based on the sorted features vs weights distributions, we can see that for Factor 3 the features do not have a normal distribution in any of omics layer. We therefore decide to get the top 10% features with the highest absolute weight to build our gene network.
Two features stand out for having significantly higher weights than all the others in the respective omics layer: hsa-miR-21-5p within microRNAs and the plasminogen activator inhibitor-1 PAI1 within proteomics, both of them associated with worse outcome in several types of cancer.
As we have done for Factor 1 and Factor 2 (see Chapter 6), we layer the multi-omics features identified with the Factor Analysis on top of a gene interaction network build by merging STRING and gene networks from OmniPath. To help to generate a simplified, more readable gene network, we can also remove the PPI interactions retrieved from STRING, and use only a gene interaction networks reconstructed from the OmniPath interaction networks.
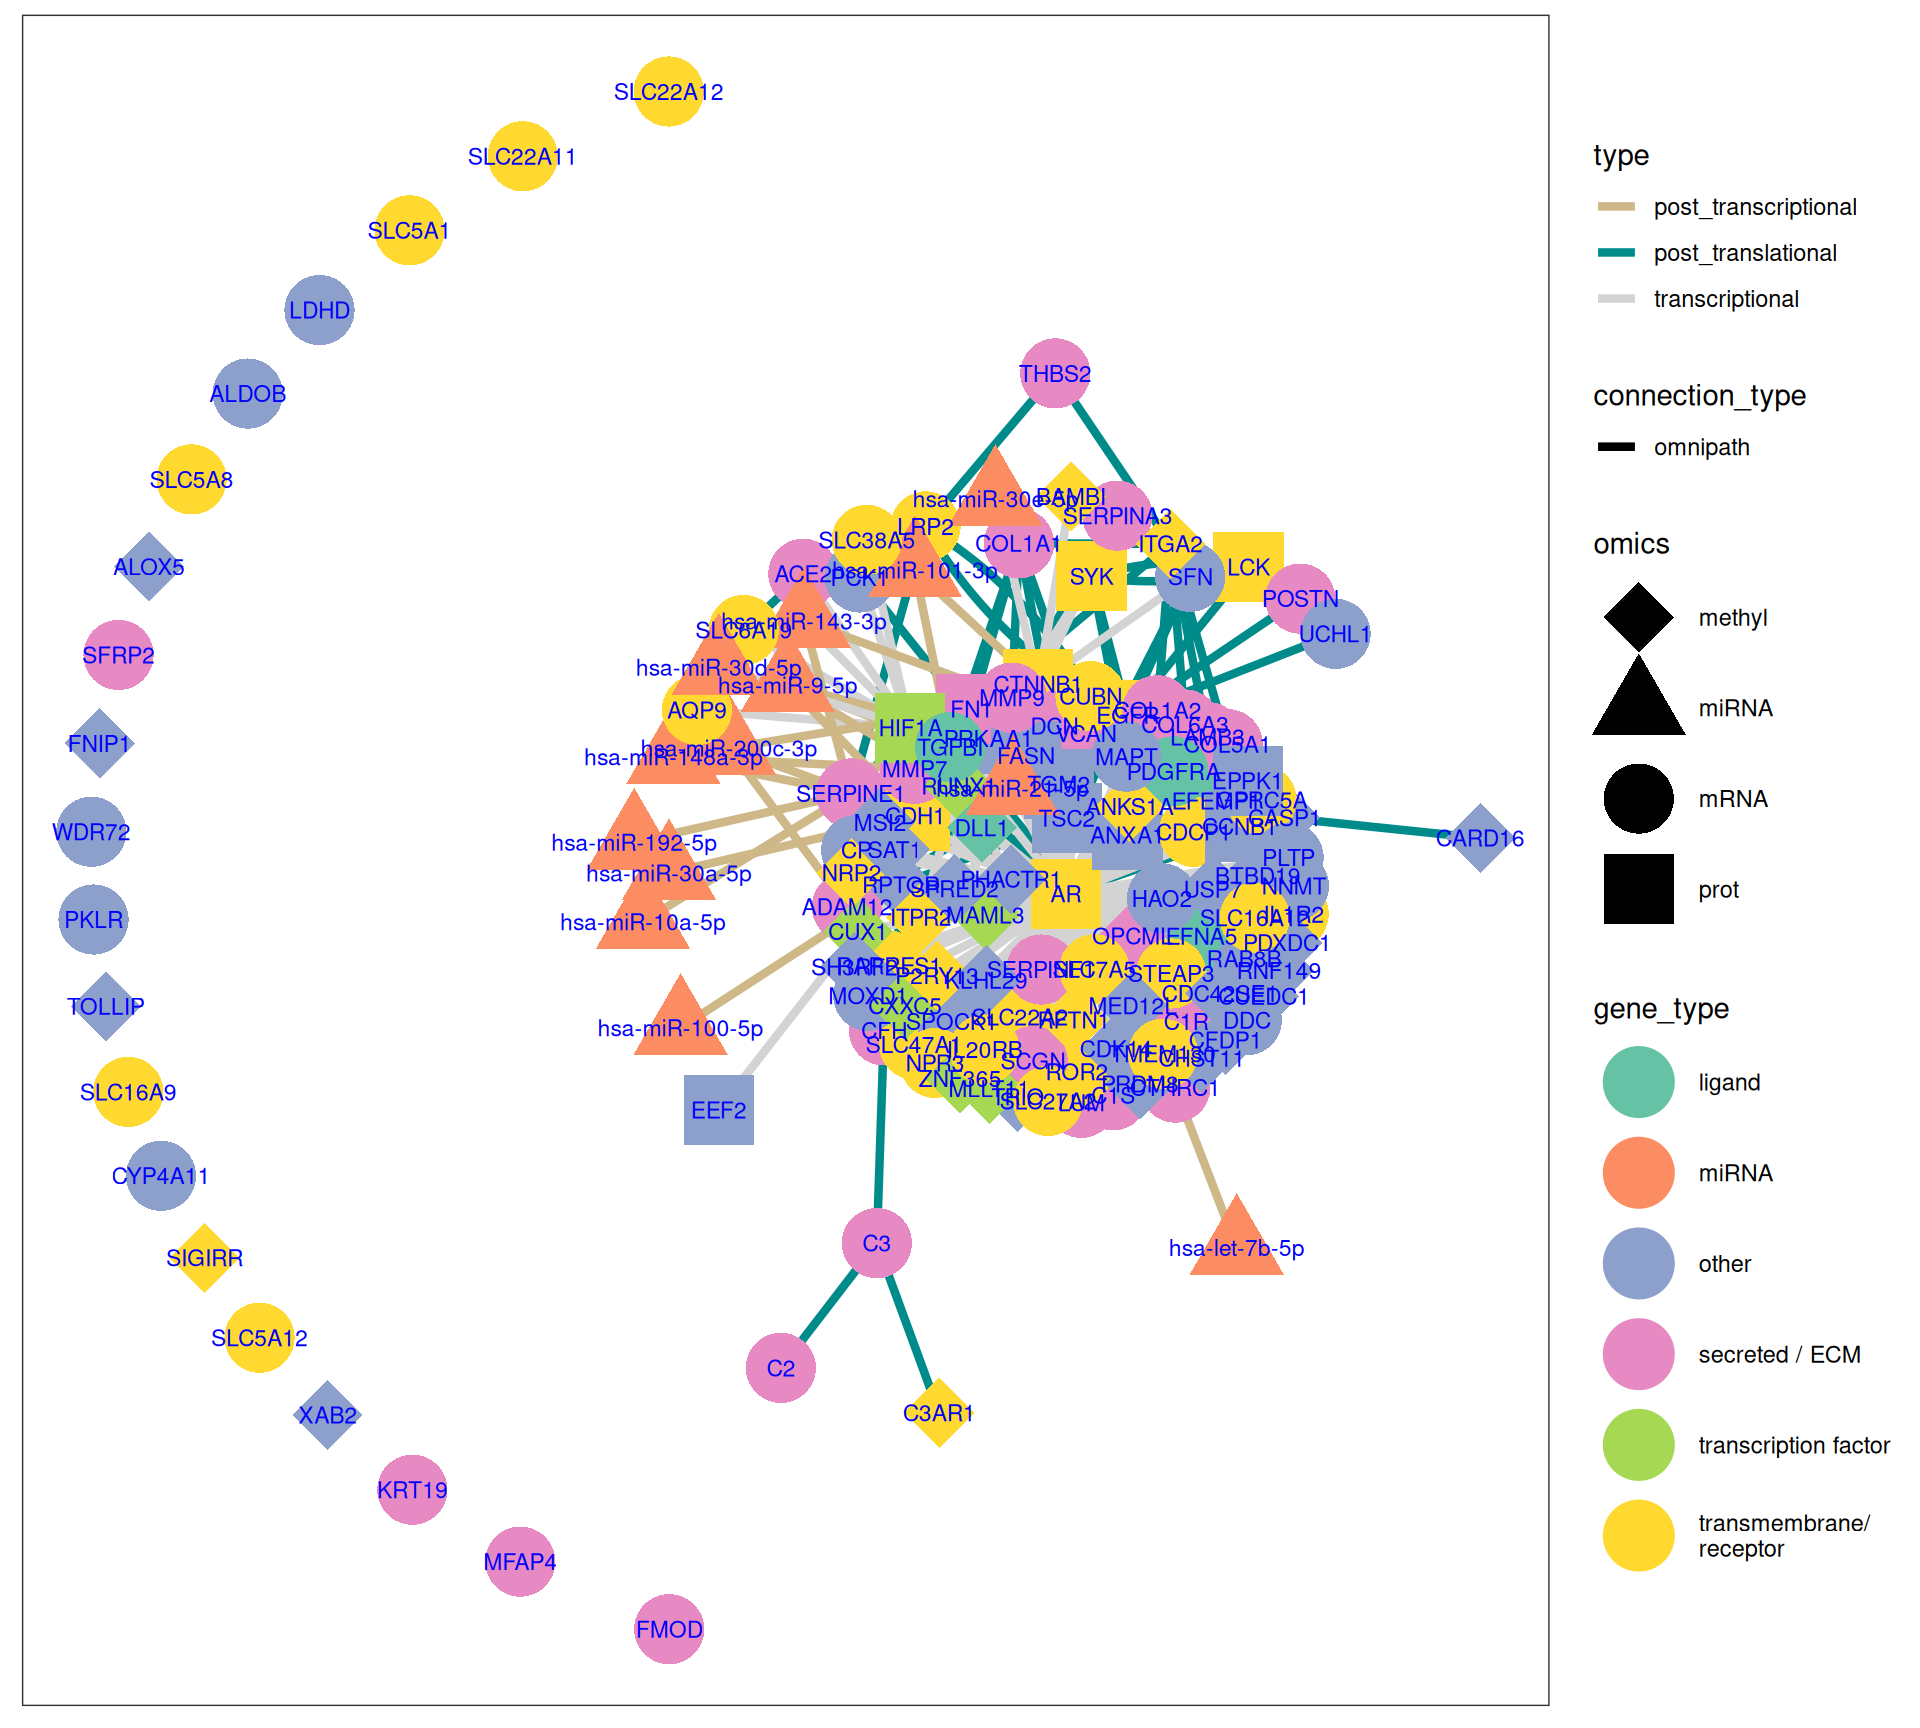
The gene interaction network we have reconstructed provides great insights on the molecular characterization of Factor 3:
- The upregulation of the following genes suggests a tumor microenvironment prone to invasion and metastasis, hallmark traits of aggressive cancers: ADAM12, COL1A2, COL5A1, COL6A3, KRT19, MMP7, MMP9, POSTN, THBS2 and VCAN.
- The upregulation of HIF1A, which regulates miR-21-5p (strong oncogenic micro-RNAs), may induce tumor cells mobility and metastasis. Downregulation of AR, CTNNB1, EGFR suggest as well altered transduction pathways (WTN/b-Catenin).
- miR-30a-5p is downregulated, potentially promoting EMT and allowing the overexpression of periostin POSTN and thrombospondin 2 THBS2.
- Strong signature of overactivation of the complement cascade, with overexpression of C2, C3, CFH, IL1R2, IL20R, TGFBI associated with pro-tumorigenic inflammatory environment and immune evasion and downregulation of C3AR1. Immune evasion mechanisms seem critical, with genes enabling the tumor to dampen immune responses and foster a pro-tumorigenic inflammatory environment.
- The tumor suppressors CDK14, CUX1 and RUNX1 were hypomethylated, while PRDM8, SEPW1 and XAB2 were hypermethylated.
- Downregulation of solute carriers SLC5A1, SLC5A8, SLC5A12, SLC6A9, SLC16A19, SLC22A11, SLC22A12, biopsies with unaltered metabolic pathways anticorrelates with worse outcome.
8.3.2 Pathway analysis
As we have done for the differentially abundant features at the single omics level, we can run a Gene Set Enrichment Analysis (GSEA) on the multi-omics features we have identified in Factor 3.
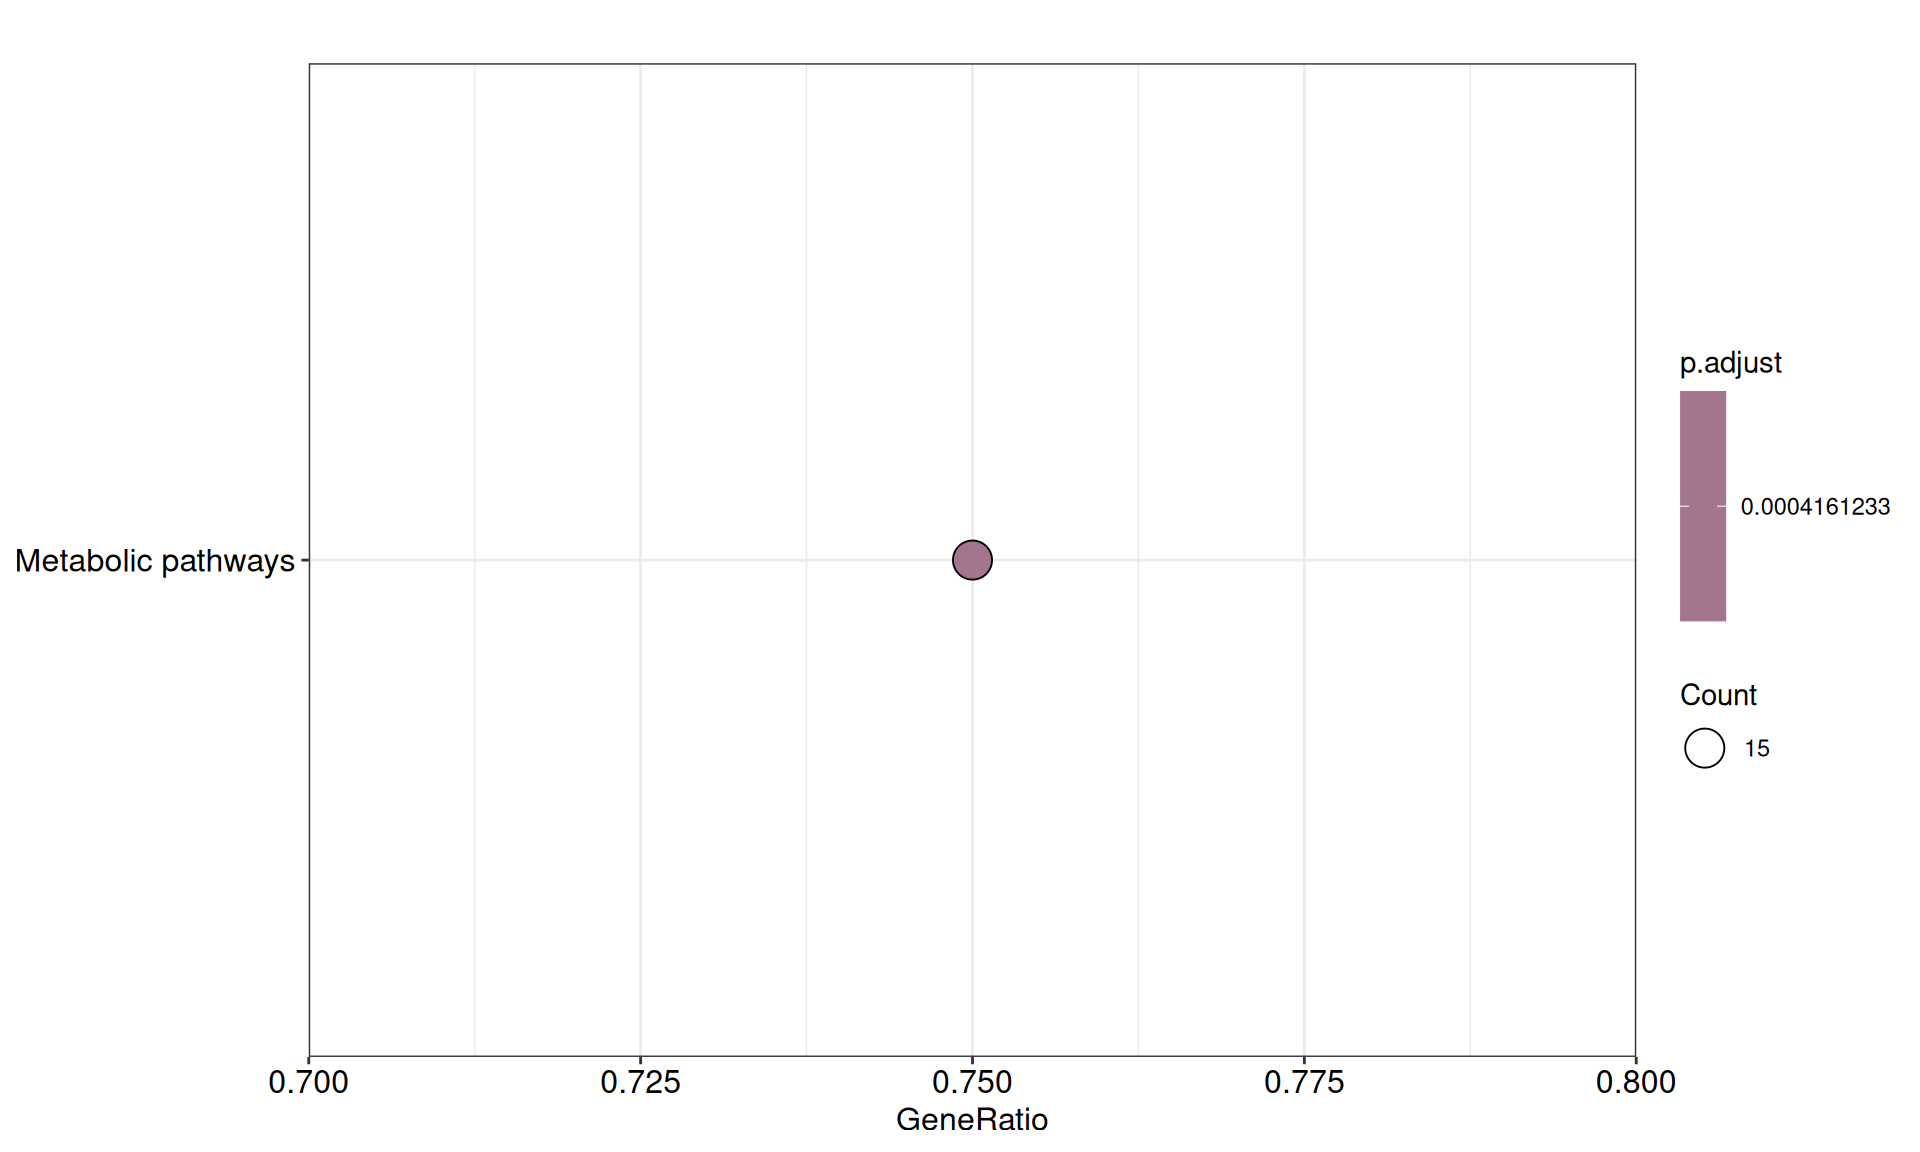
We gathered the following insights from the gene set enrichment analyses:
- We could not find any enriched relevant GO terms.
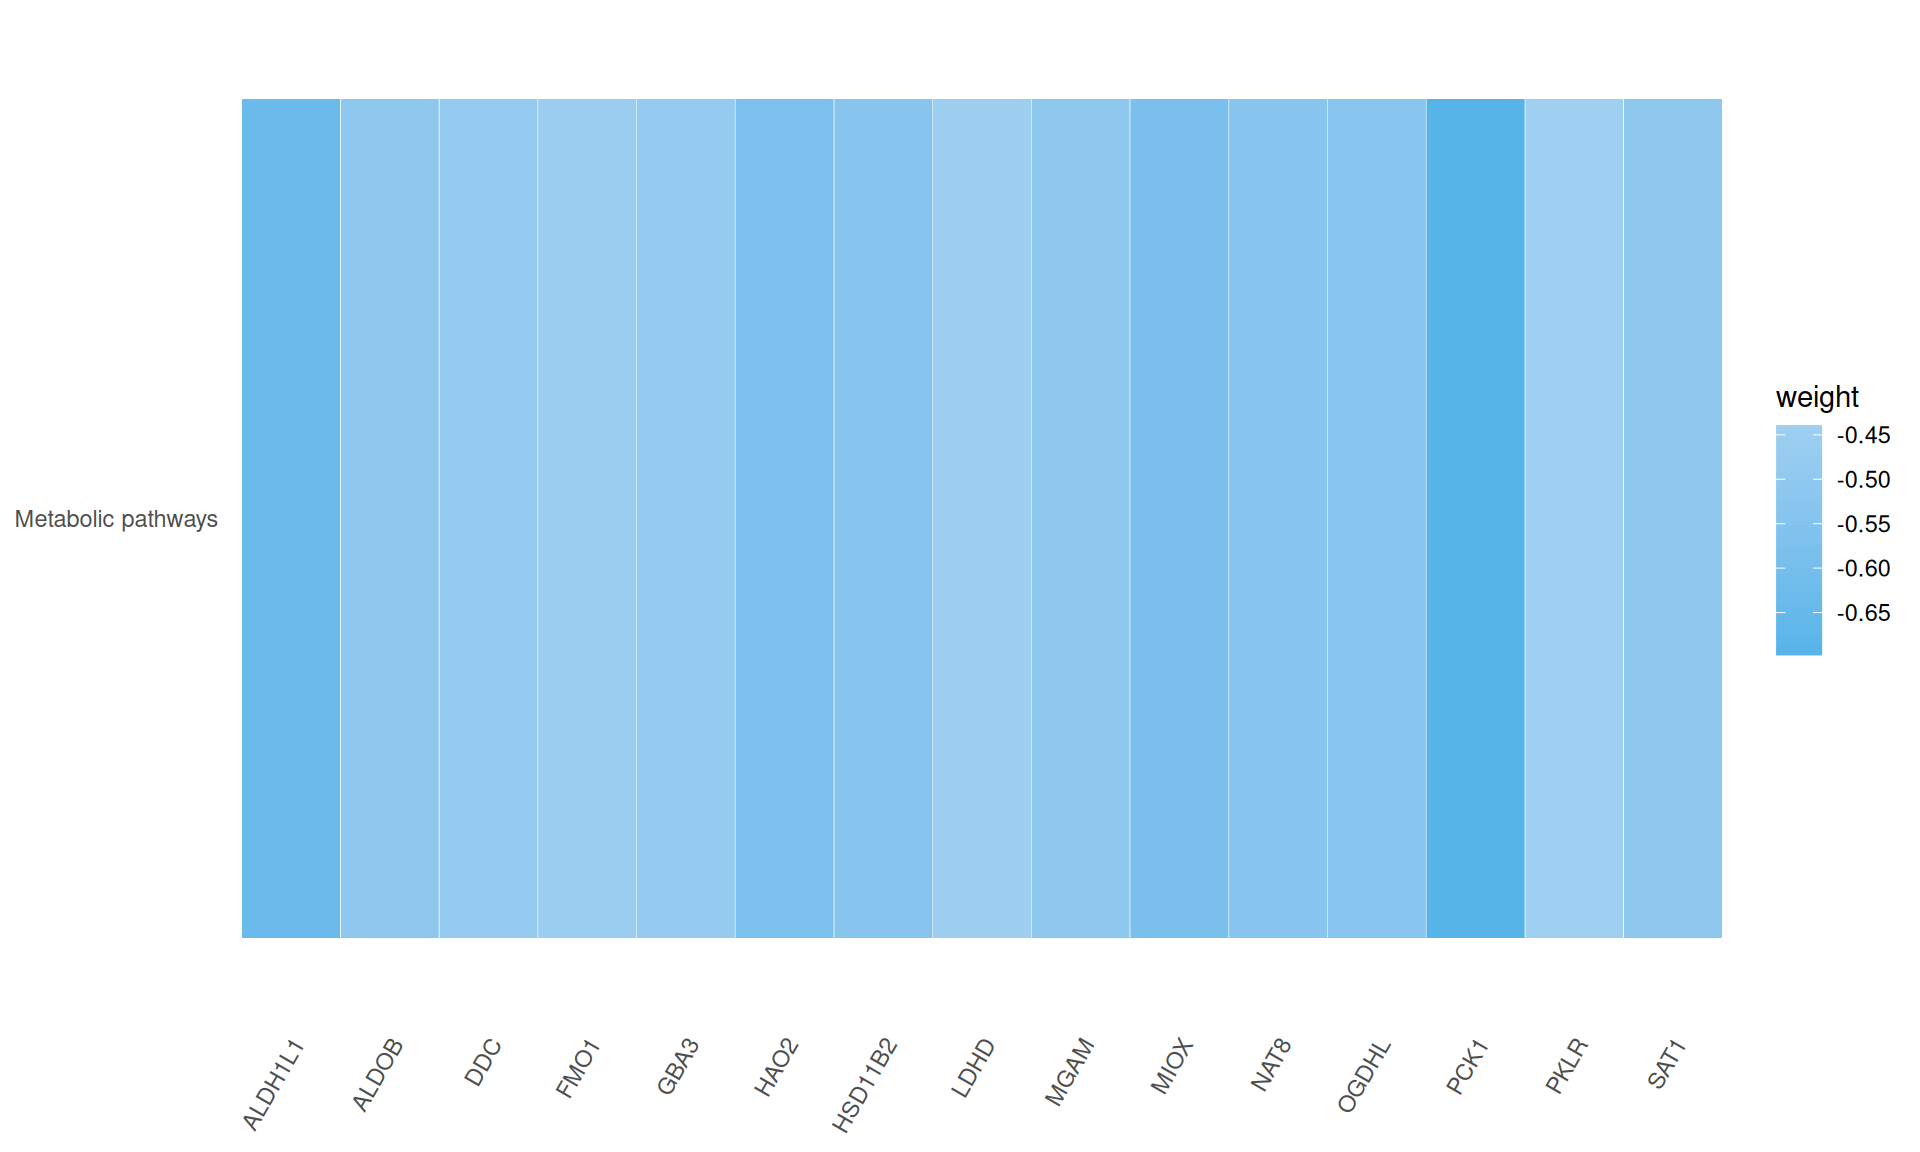
- We identified a single enriched KEGG pathway, metabolic pathways, for which 15/20 genes had negative weights in Factor 3: ALDH1L1, ALDOB, DDC, FMO1, GBA3, HAO2, HSD11B2, LDHD, MGAM, MIOX, NAT8, OGDHL, PCK1, PKLR, SAT1.
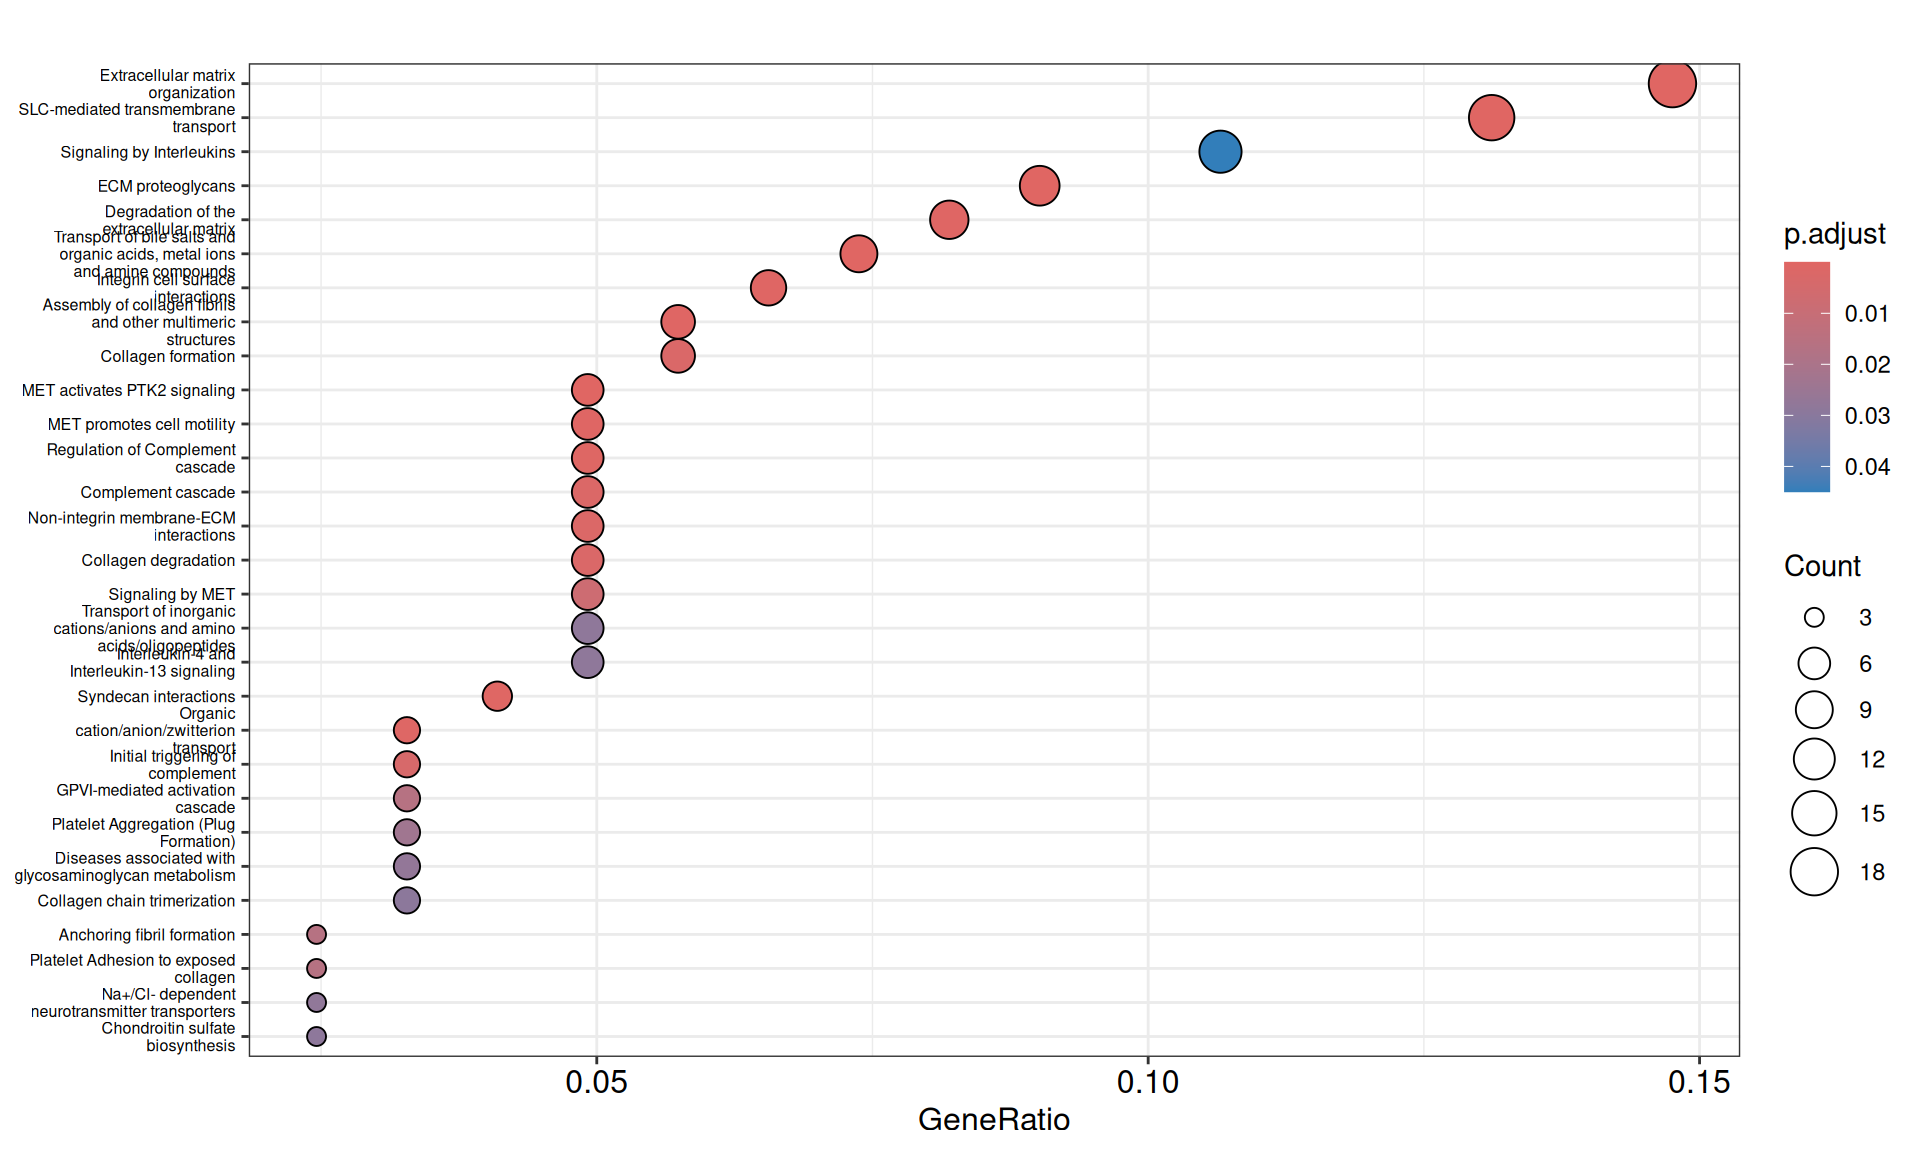
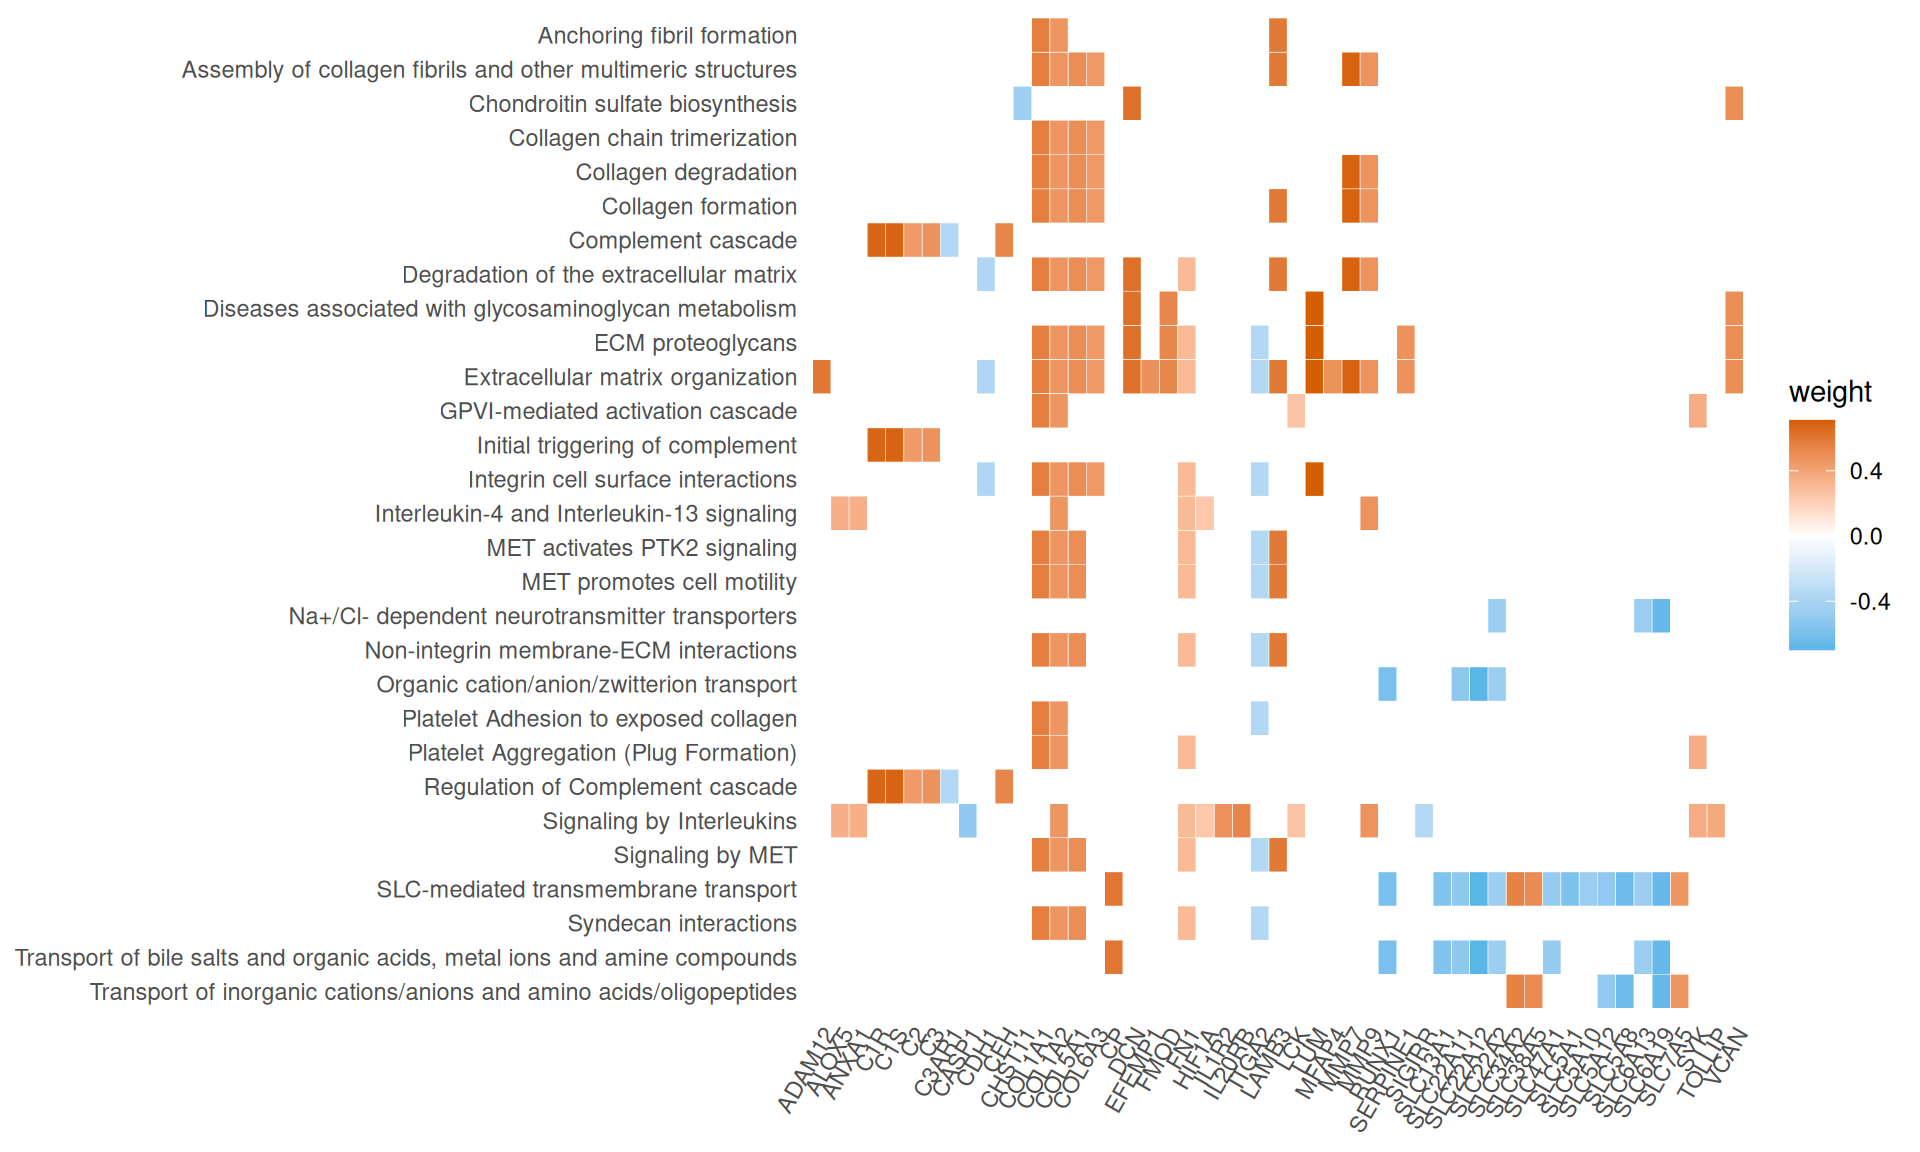
- We have identified 29 Reactome Pathways with an adjusted p-value =< 0.05. These pathways underly three biological themes:
- Complement cascade and signaling by interleukins, driven by the genes with positive weigths ALOx5, ANXA1, C1R, C1S, C2, C3, CFH, HIF1A, IL1R2, IL20RB, SYK, TOLLIP, and negative weights C3AR1, CASP1.
- Extracellular matrix organization, Collagen formation and MET-mediated cell migration, driven by the genes with positive weigths ADAM12, COL1A1, COL1A2, COL5A1, COL6A3, DCN, EFEMP1, FMOD, FN1, LUM, MFAP4, MMP7, MMP9, VCAN, and negative weights CDH1 and ITGA2.
- SLC-mediated transmembrane transport, driven by the genes with negative weights SLC5A1, SLC5A8, SLC5A10, SLC5A12, SLC6A13, SLC6A19, SLC13A1, SLC22A2, SLC22A11, SLC22A12, SLC47A1.
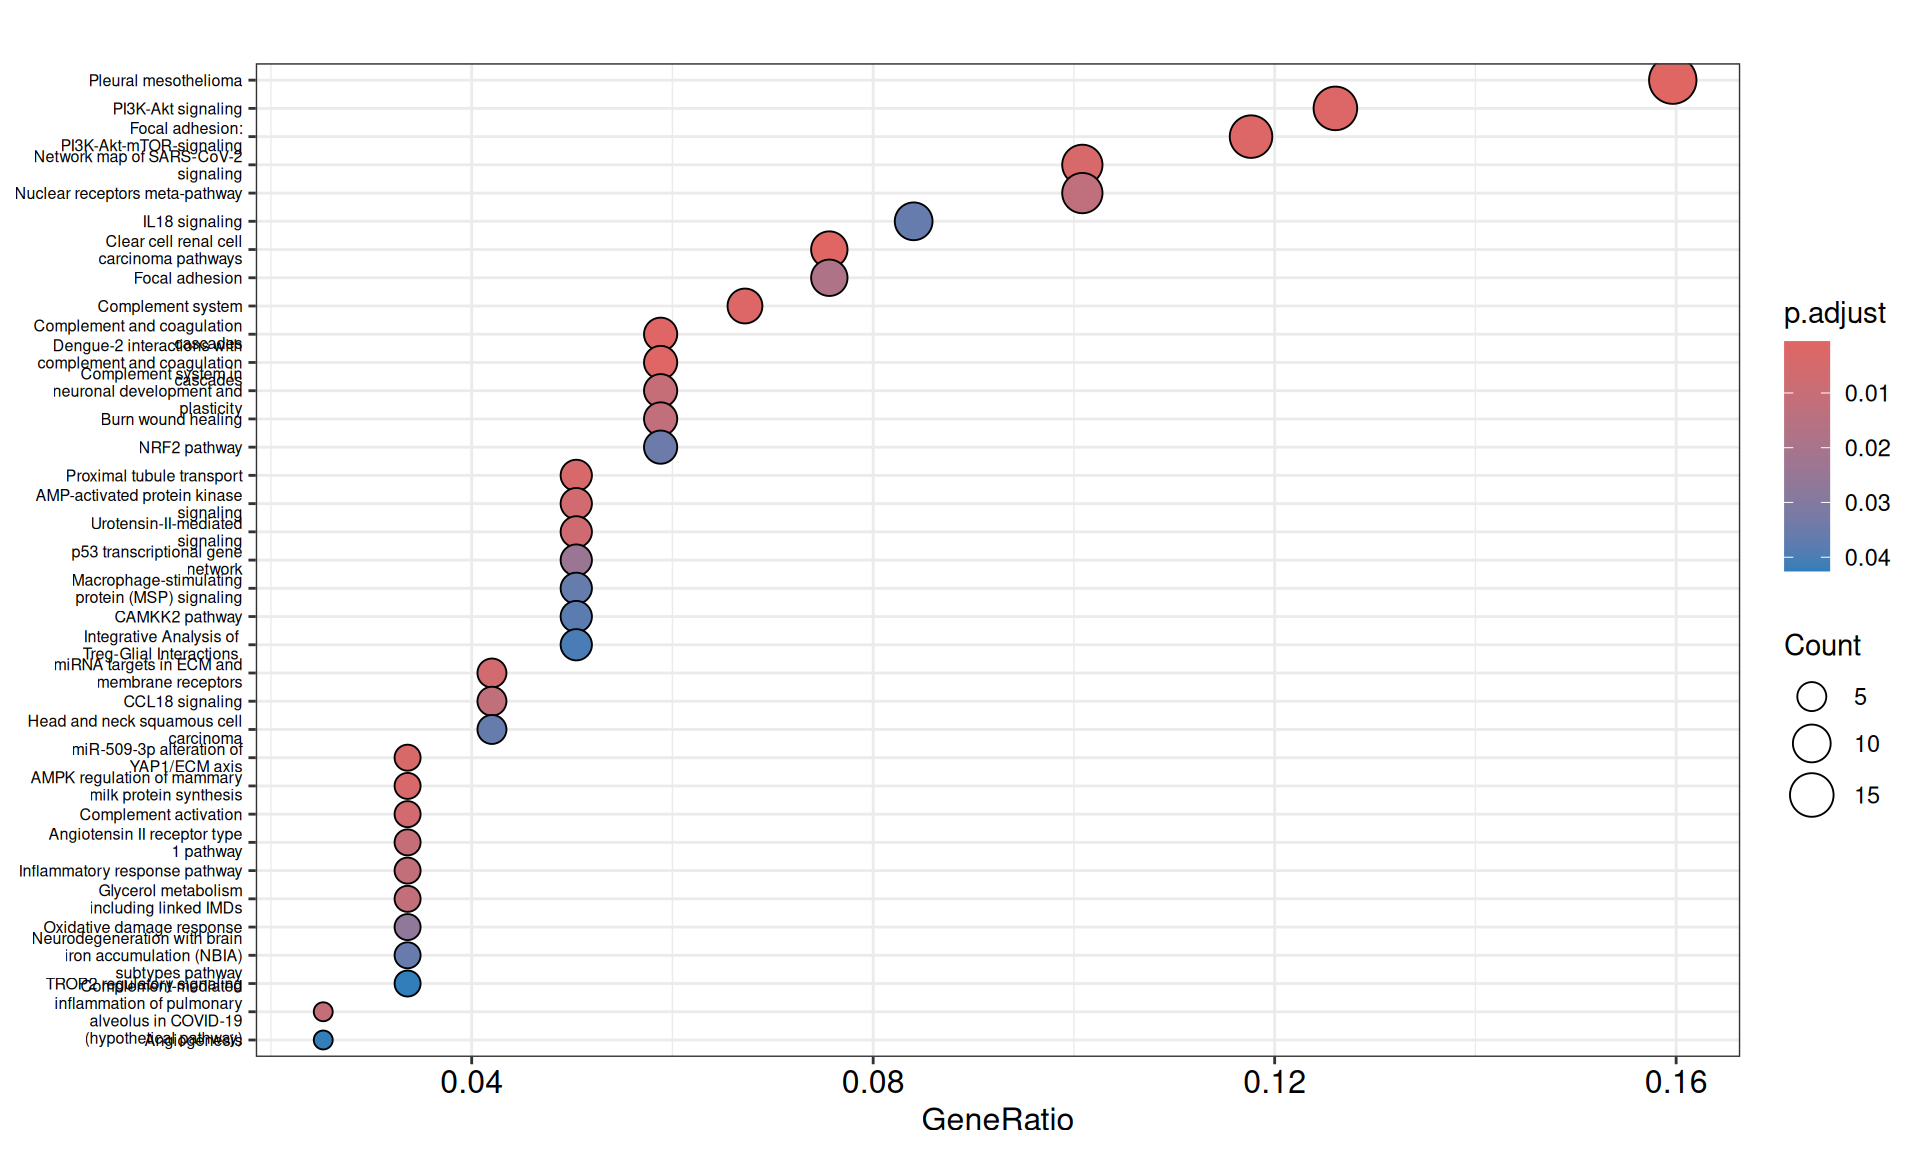
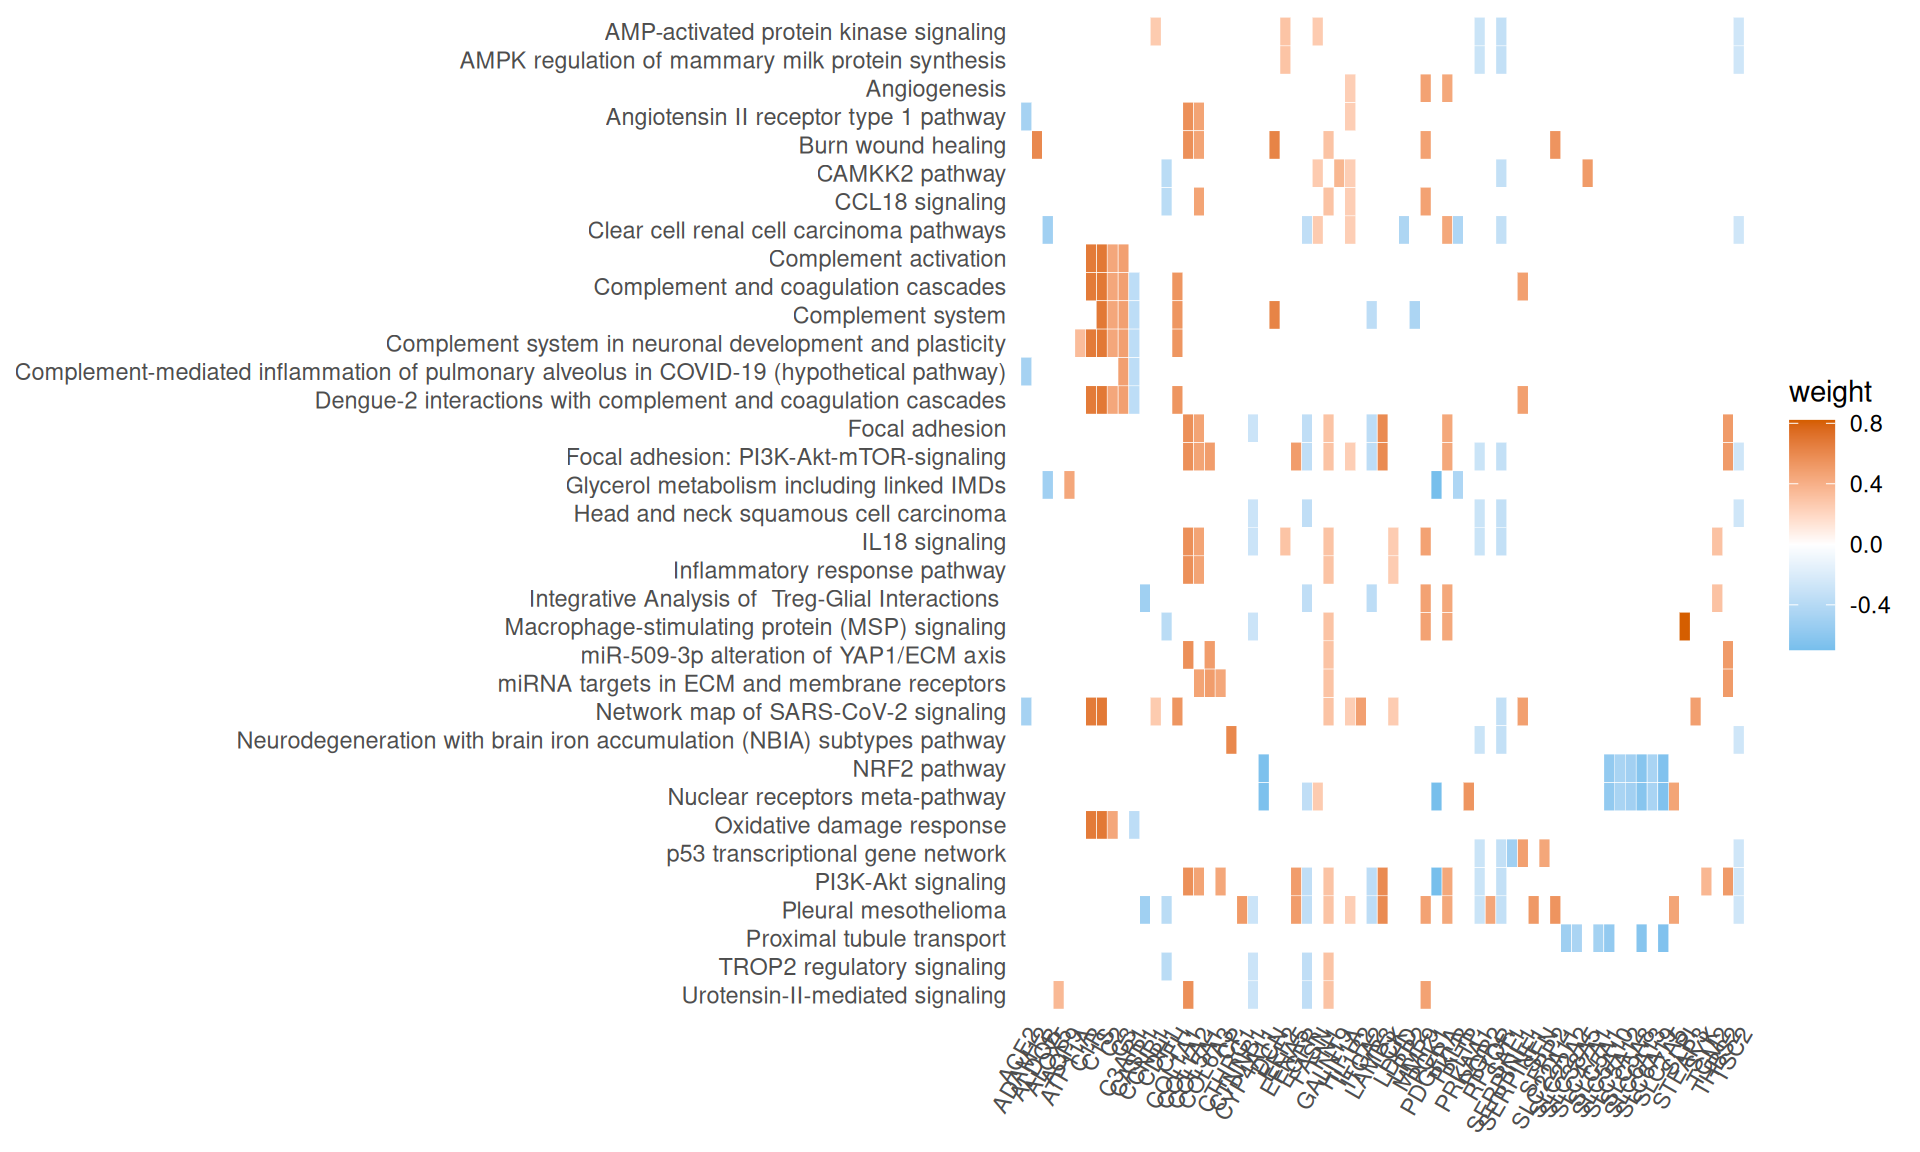
- We have identified 33 Wikipathways with an adjusted p-value =< 0.05, with pathways overlapping functionally to what identified with Reactome.
The combination of transcriptomics, proteomics, micro-RNA and epigenomics signal allowed the reconstruction of a molecular network of interactions that properly describe Factor 3. For each feature, we have information on its weight on the model, the omic origin (e.g: transcriptomics evidence), their molecular function (e.g.: transcription factor, transmembrane receptor, etc.) and the nature of the molecular interaction with the other features in the model.
8.4 Infiltrating immune cells in Factor 3
The characterization of the tumor micro-environment can provide insights on providing the best personalized therapies for the patients. Moreover, different tumor-infiltraing immune cells profiles are linked to a more favourable or a worse prognosis in various cancer types. We can characterize the infiltrating immune cells in Factor 3 patients as we have characterized the tumor micro-environment in the three different kidney carcinoma types, looking at the gene expresison in the transcriptomics data (see also Chapter 2).
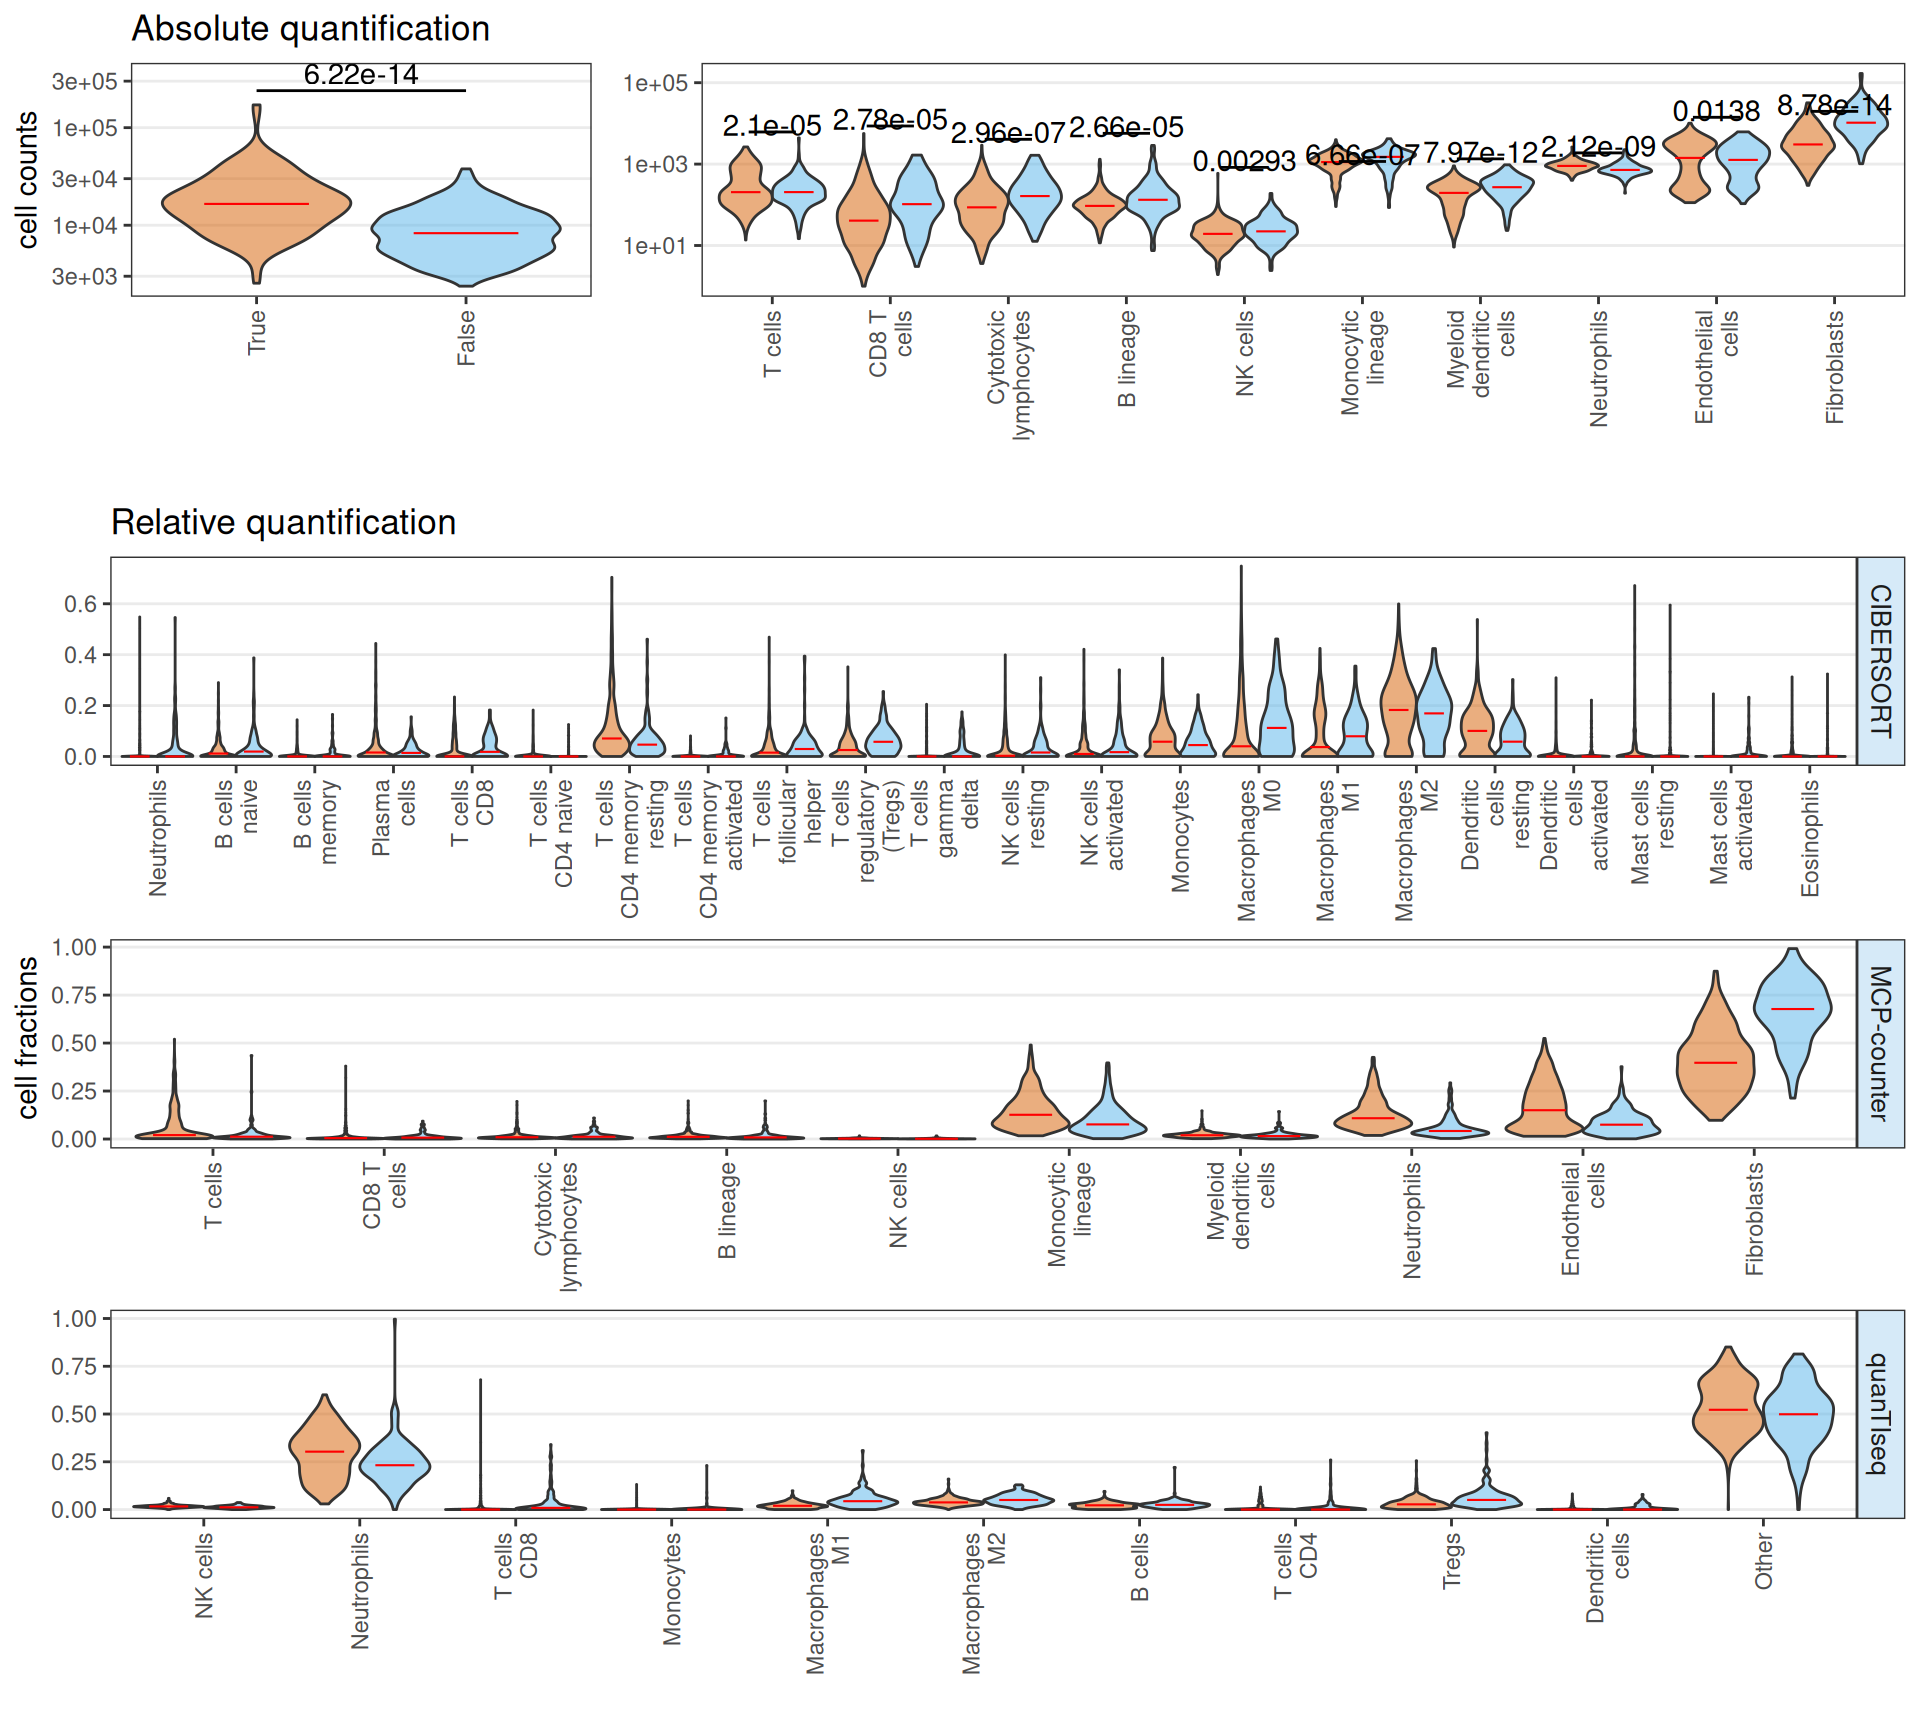
The estimated infiltrting immune cells suggests that Factor 3 patients have on average a significantly higher amount of total infiltrating immune cells, with a significant increase on absolute number of CD8 T cells, cytotoxic lymphocytes, B cells and fibroblasts. Neutrophiles and endothelial cells seems less abundant in Factor 3 patients when compared to non-Factor 3 patients. In terms of relative abundance, Factor 3 patients tumor micro-environment is enriched in CD8 T cells, T cells follicular, T regs, Macrophages M0 and Fibroblasts, and depleted in T cells CD4 memory, Neutrophiles, Macrophaeges M2 and resting Dendritic cells.
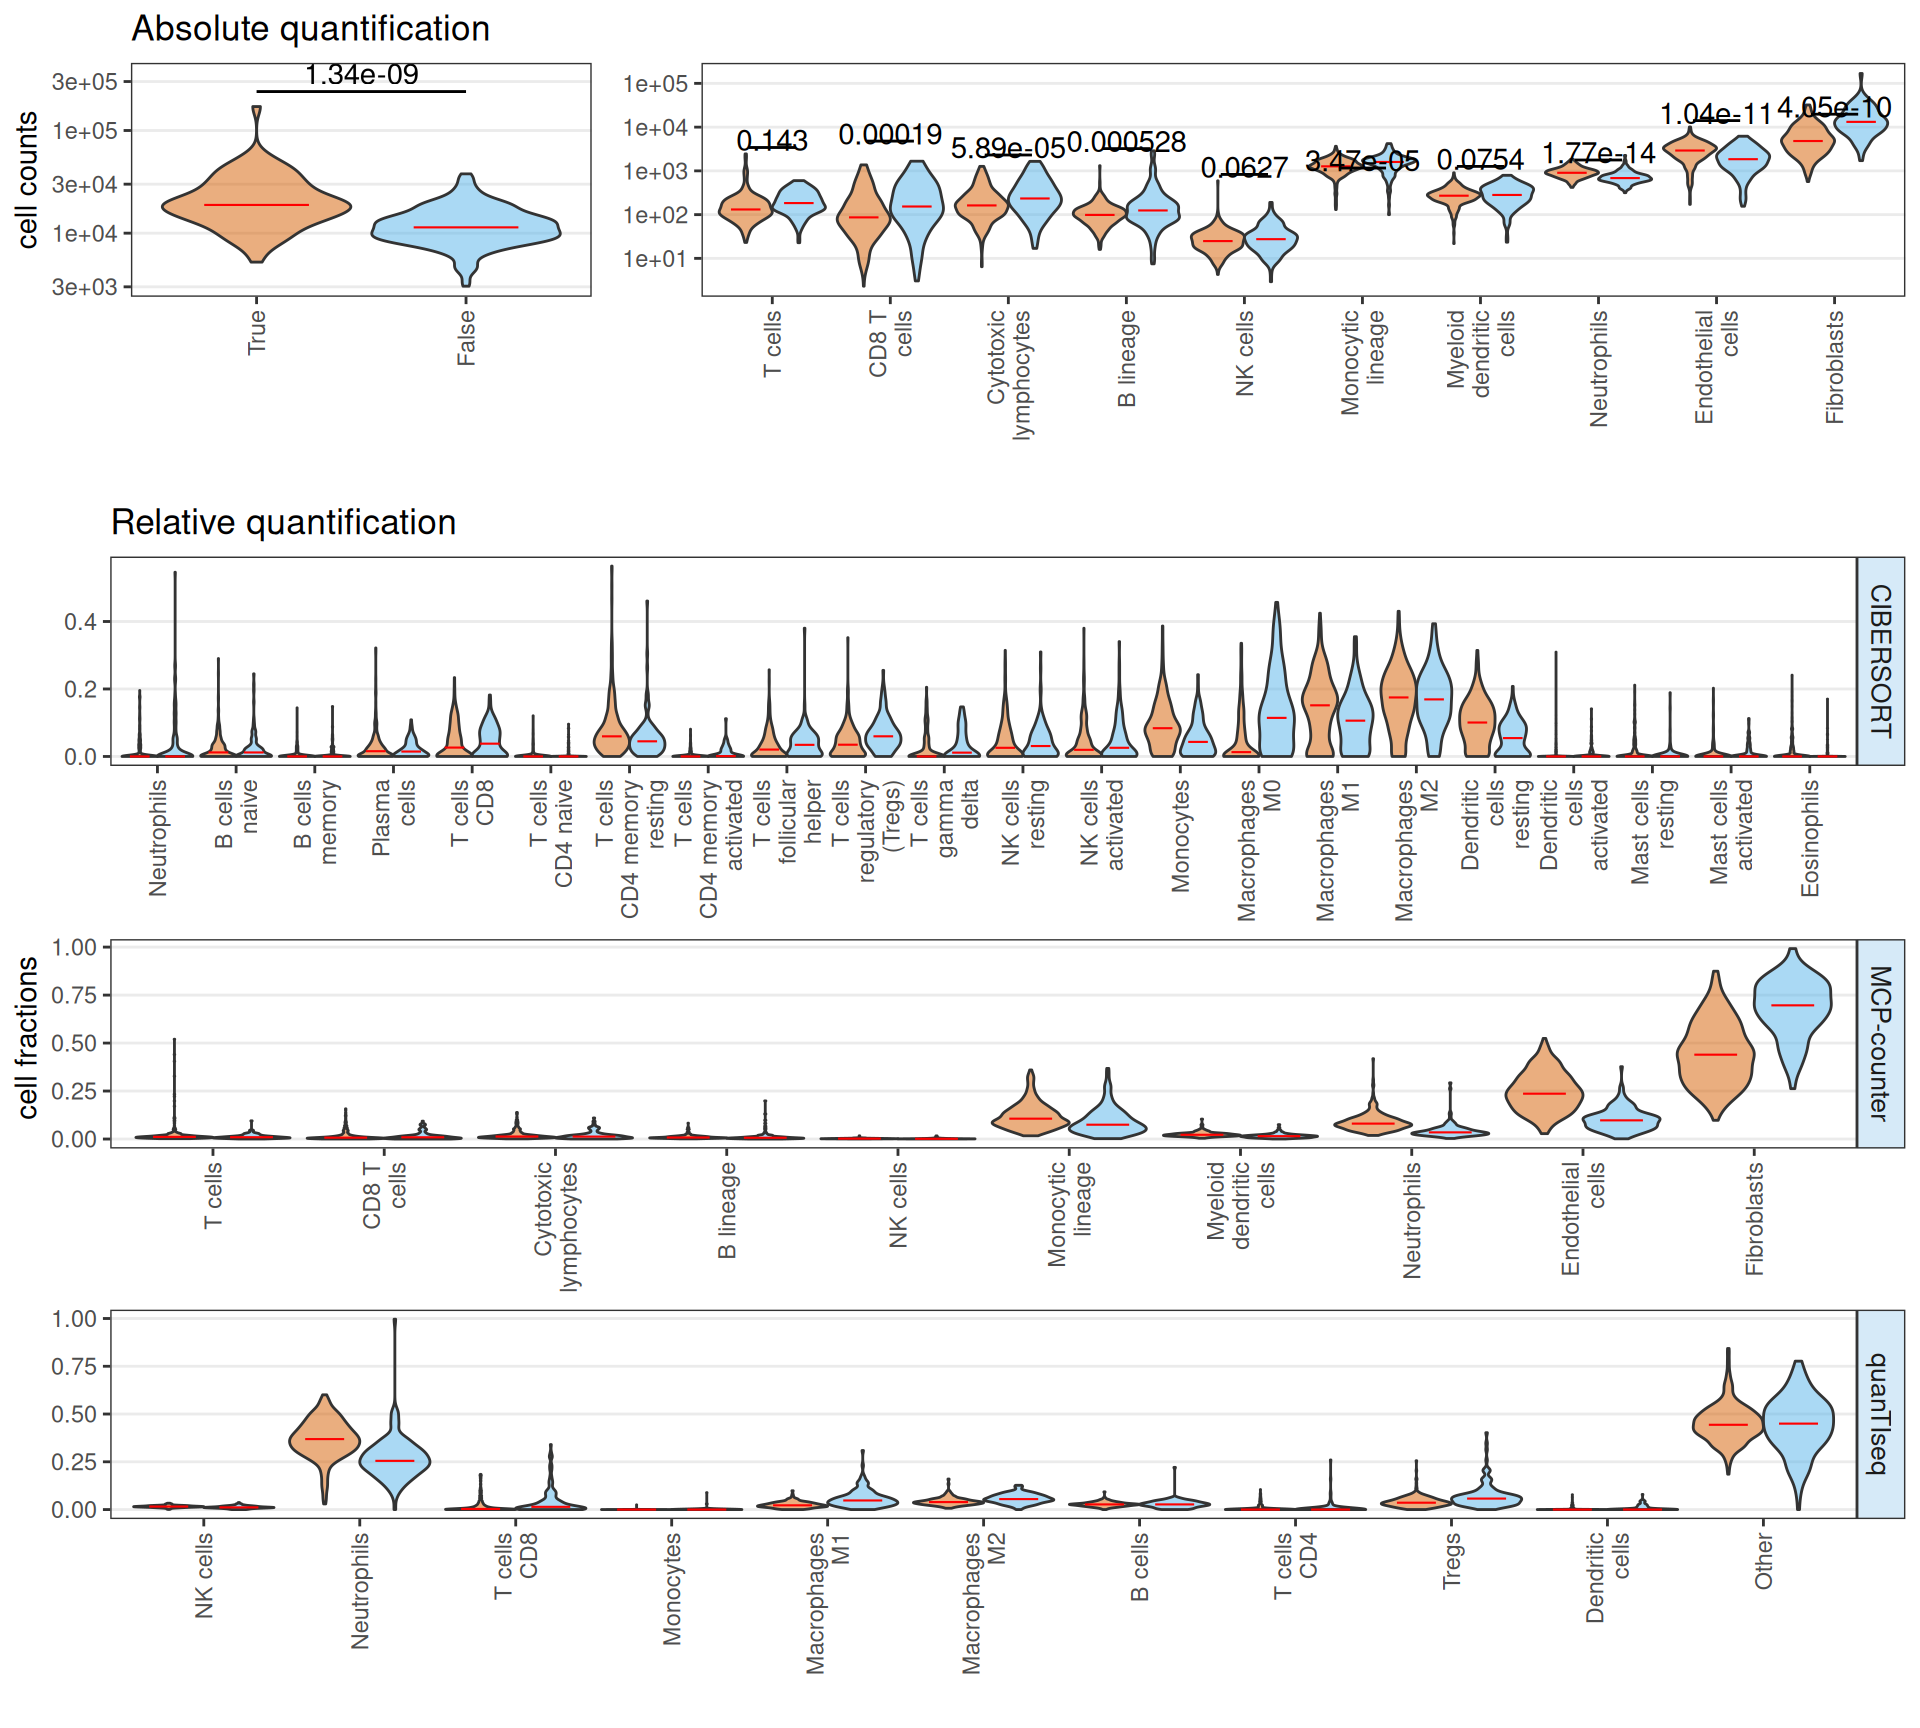
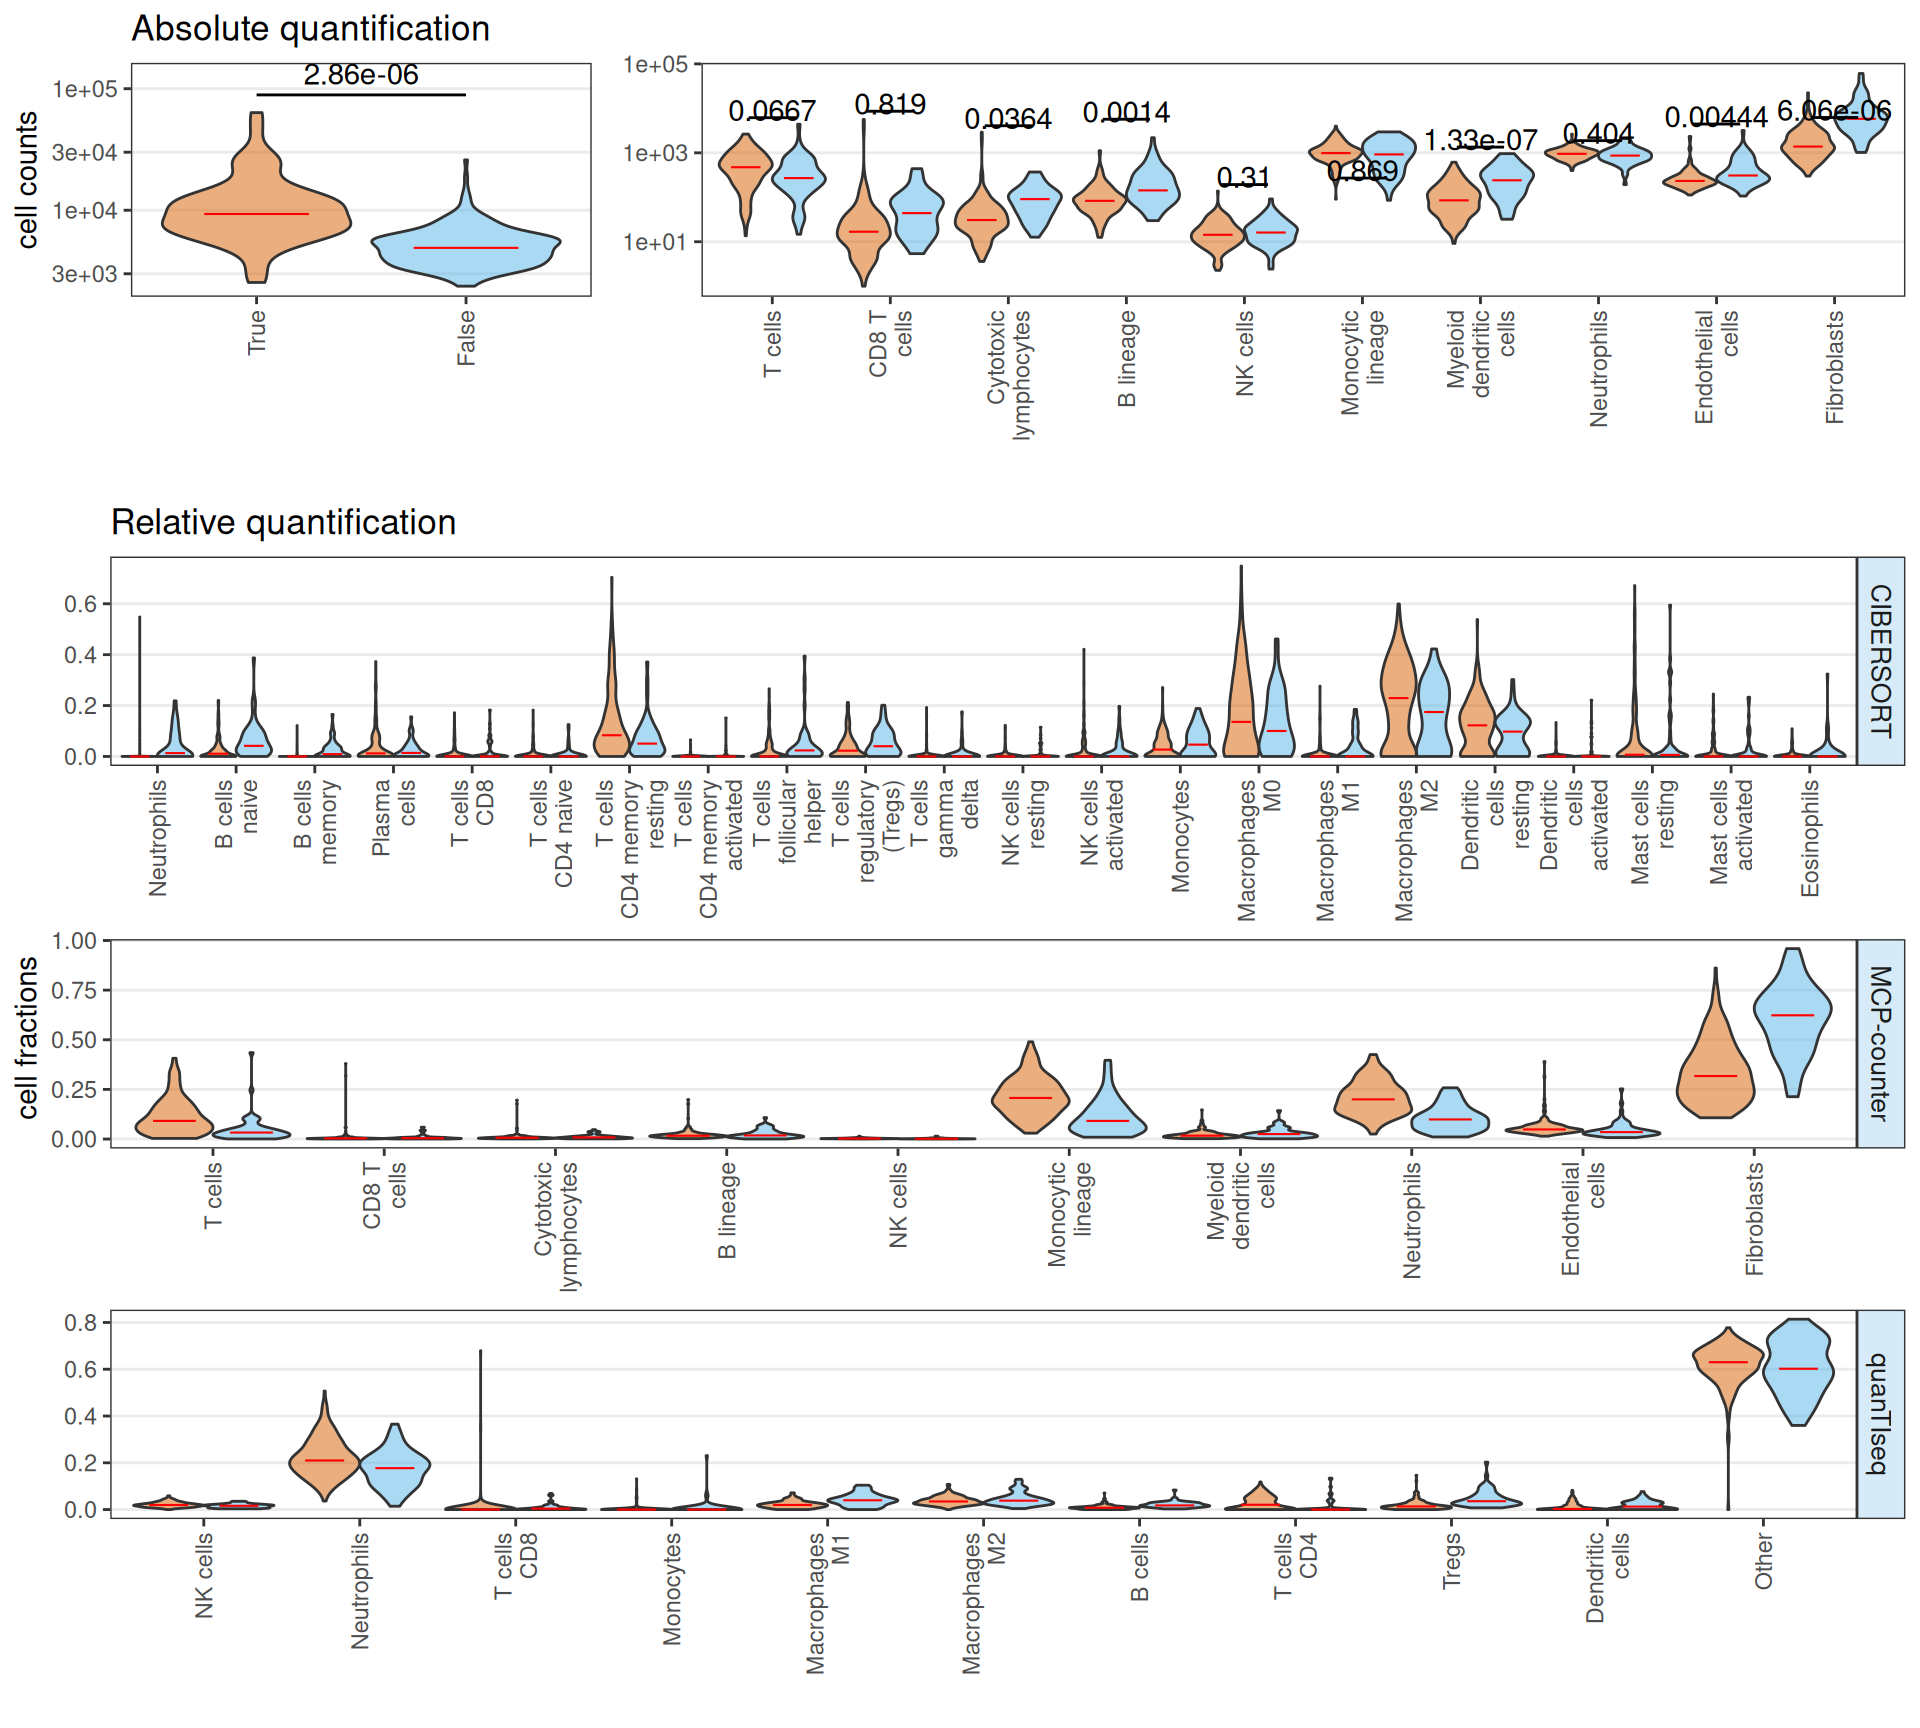
If we stratify the Factor 3 patients by cancer type (i.e.: KIRC or KIRP), we obtain a similar overall picture, with the observation that KIRC Factor 3 patiens seems to have twice the total infiltrating immune cells than KIRP Factor 3 patients. Overall, these results suggest that Factor 3 biopsies have a strong immuno-engaged tumor micro-enviroment with immuno-evasive characteristics (i.e.: high fraction of CD8 T cells, T cells follicular, T regs) when compared to non-Factor 3 biopsies.
8.5 CNVs on Factor3 genes
Due to their data shape, we have not included Copy Number Variants (CNVs) information in the multi-omics factor analysis that led to the identification of Factor 3. However, we can test if any specfic CNV or CNV signature is enriched in Factor 3 biopsies.
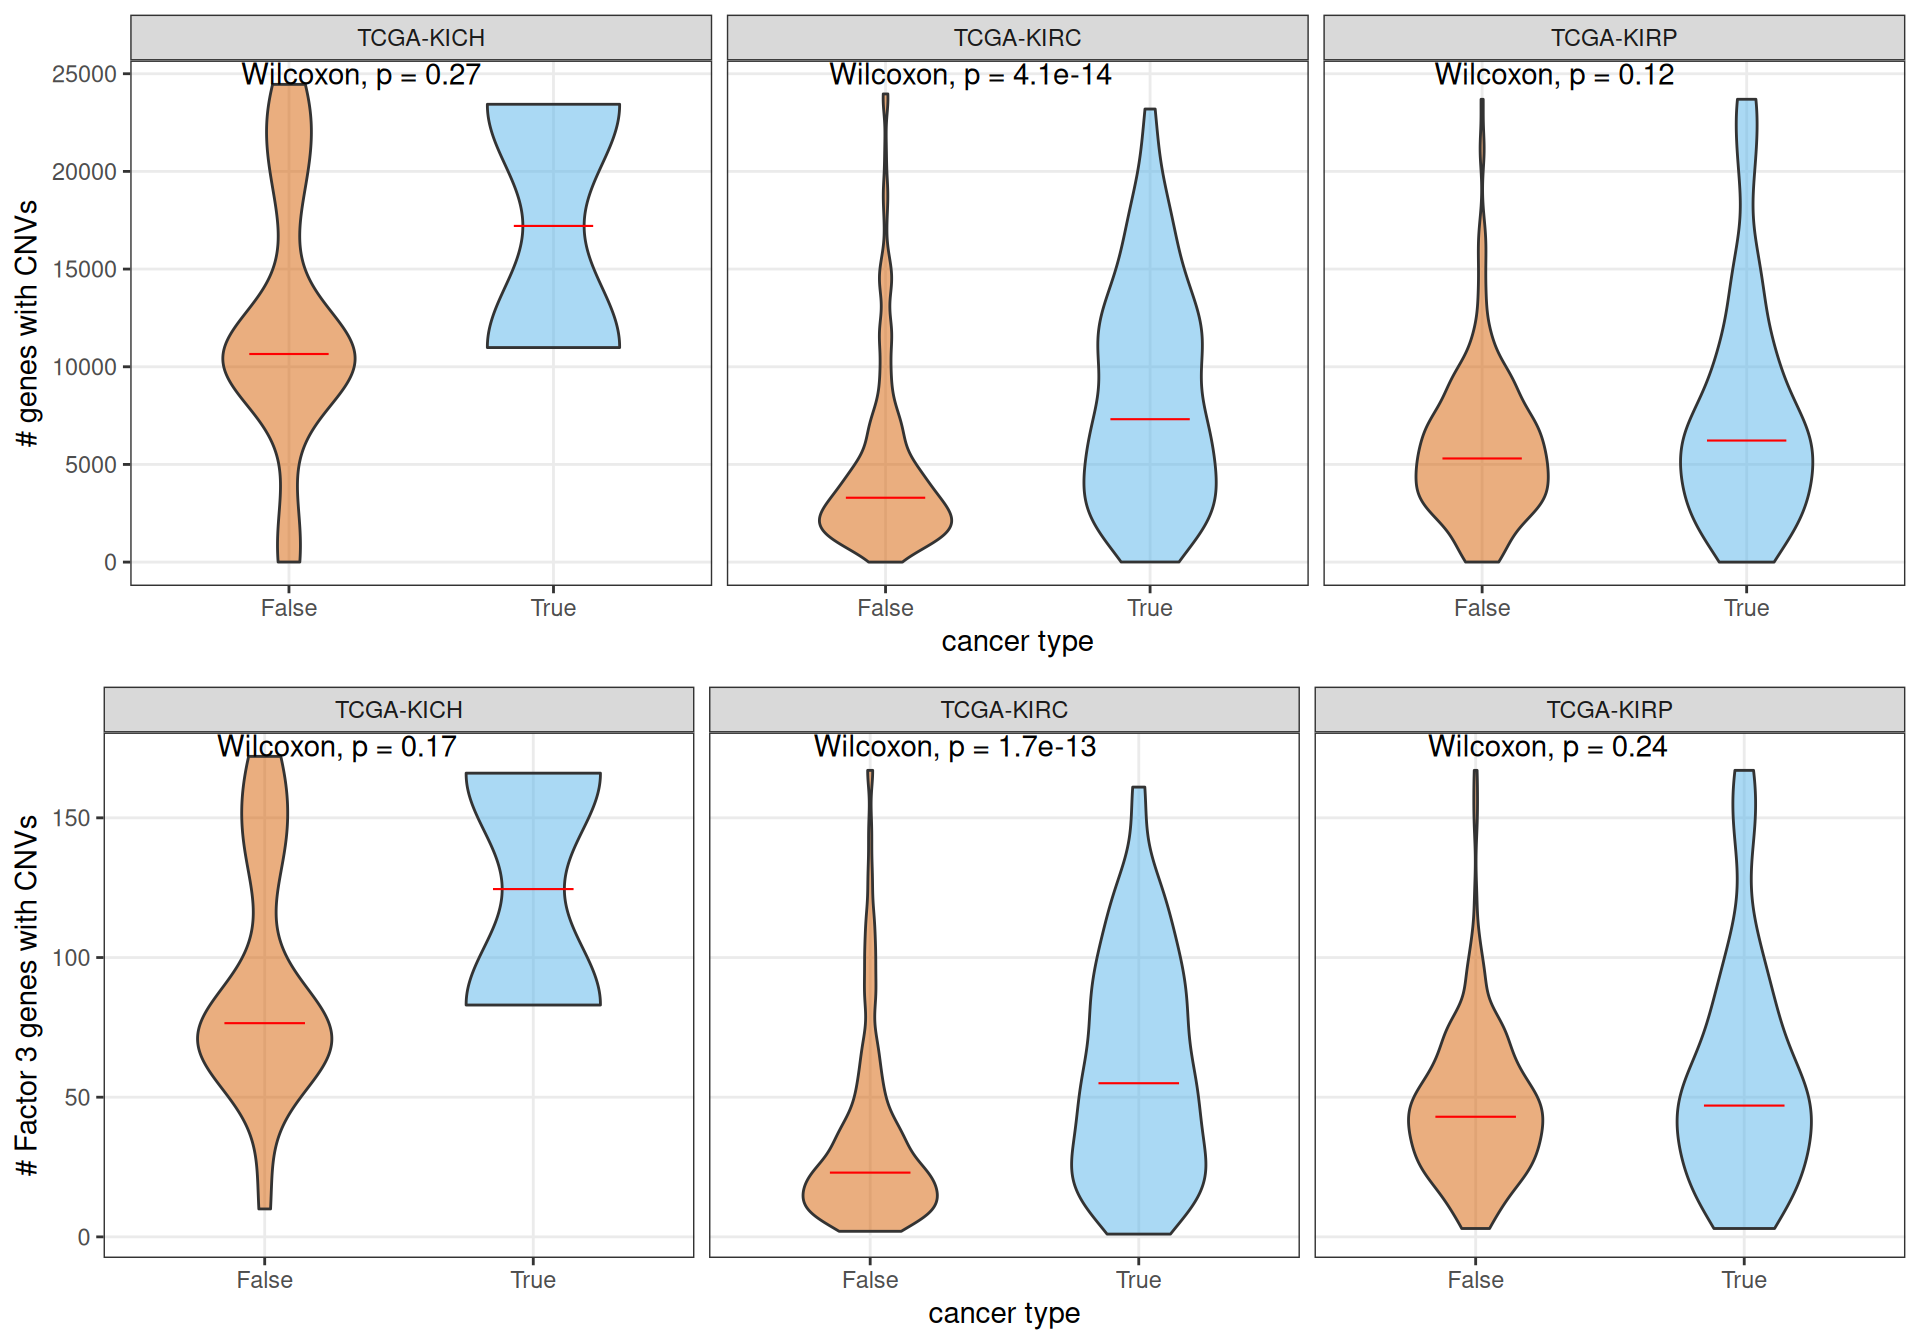
In our genomics analyses (see Chapter 5), we observed that KICH patients had on average a higher number of genes affecte dby CNVs, followed by KIRP patients, and KIRC patients had the lowest number of genes affected by CNVs on average. If we stratify the patients by kidney carcinoma type and being part of Factor 3, we observe that, on average, KIRC Factor 3 patients have significantly more genes affected by CNVs than patients that are not Factor 3. This holds true for all genes, as well as for the Factor 3 genes that we have identified with the multi-omics factor analysis. Moreover, Factor 3 KIRC patients have on average more genes affected by CNVs than Factor 3 KIRP patients. This results suggest that KIRC Factor 3 cancers have overall a higher genomic instability.
8.5.1 CNVs signatures associated to Factor3
We can plot the distribution of CNVs across the genome of the patients stratified by Factor 3 and by kidney carcinoma. Despite the fact that Factor 3 patients have on average more genes affected by CNVs, we cannot spot any obvious CNV signature associated with Factor 3. Factor 3 patients were not further stratified for KICH, since only 2 KICH patients belong to Factor 3.
            used   (Mb) gc trigger    (Mb)   max used    (Mb)
Ncells  26016951 1389.5   43718764  2334.9   43718764  2334.9
Vcells 270979168 2067.5 1712707935 13067.0 1920414240 14651.6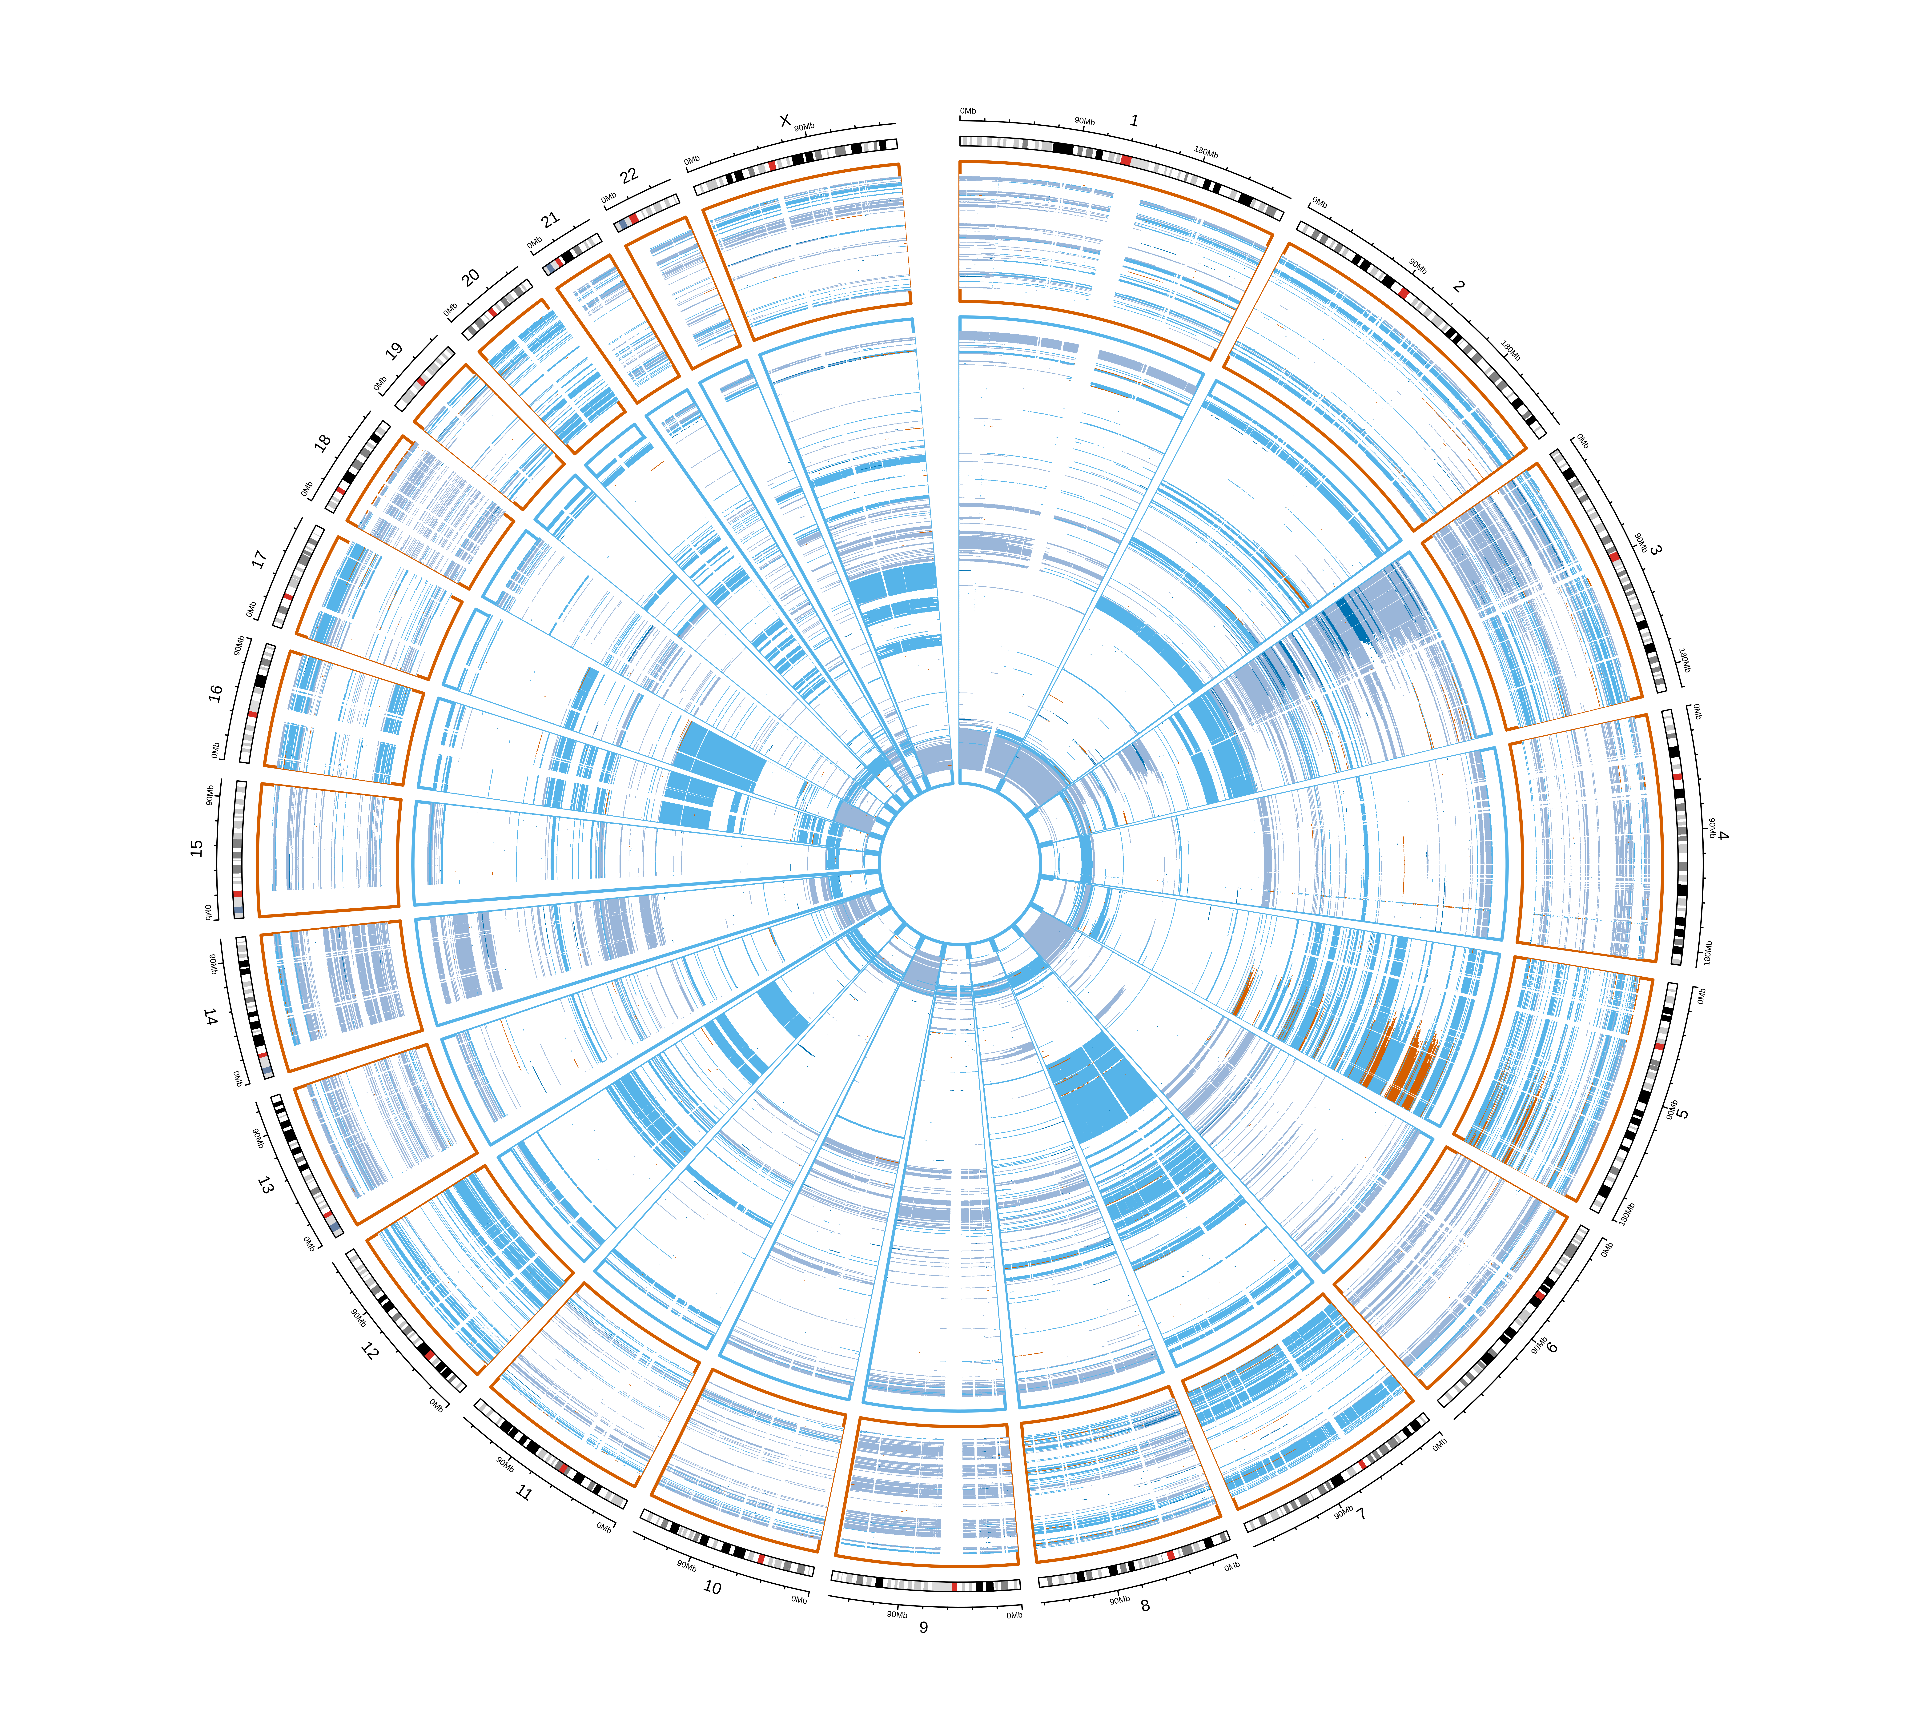
            used   (Mb) gc trigger    (Mb)   max used    (Mb)
Ncells  26006058 1388.9   43718764  2334.9   43718764  2334.9
Vcells 435514212 3322.8 1370166348 10453.6 1920414240 14651.6
used (Mb) gc trigger (Mb) max used (Mb)
Ncells 26003902 1388.8 43718764 2334.9 43718764 2334.9
Vcells 267127924 2038.1 1096133079 8362.9 1920414240 14651.6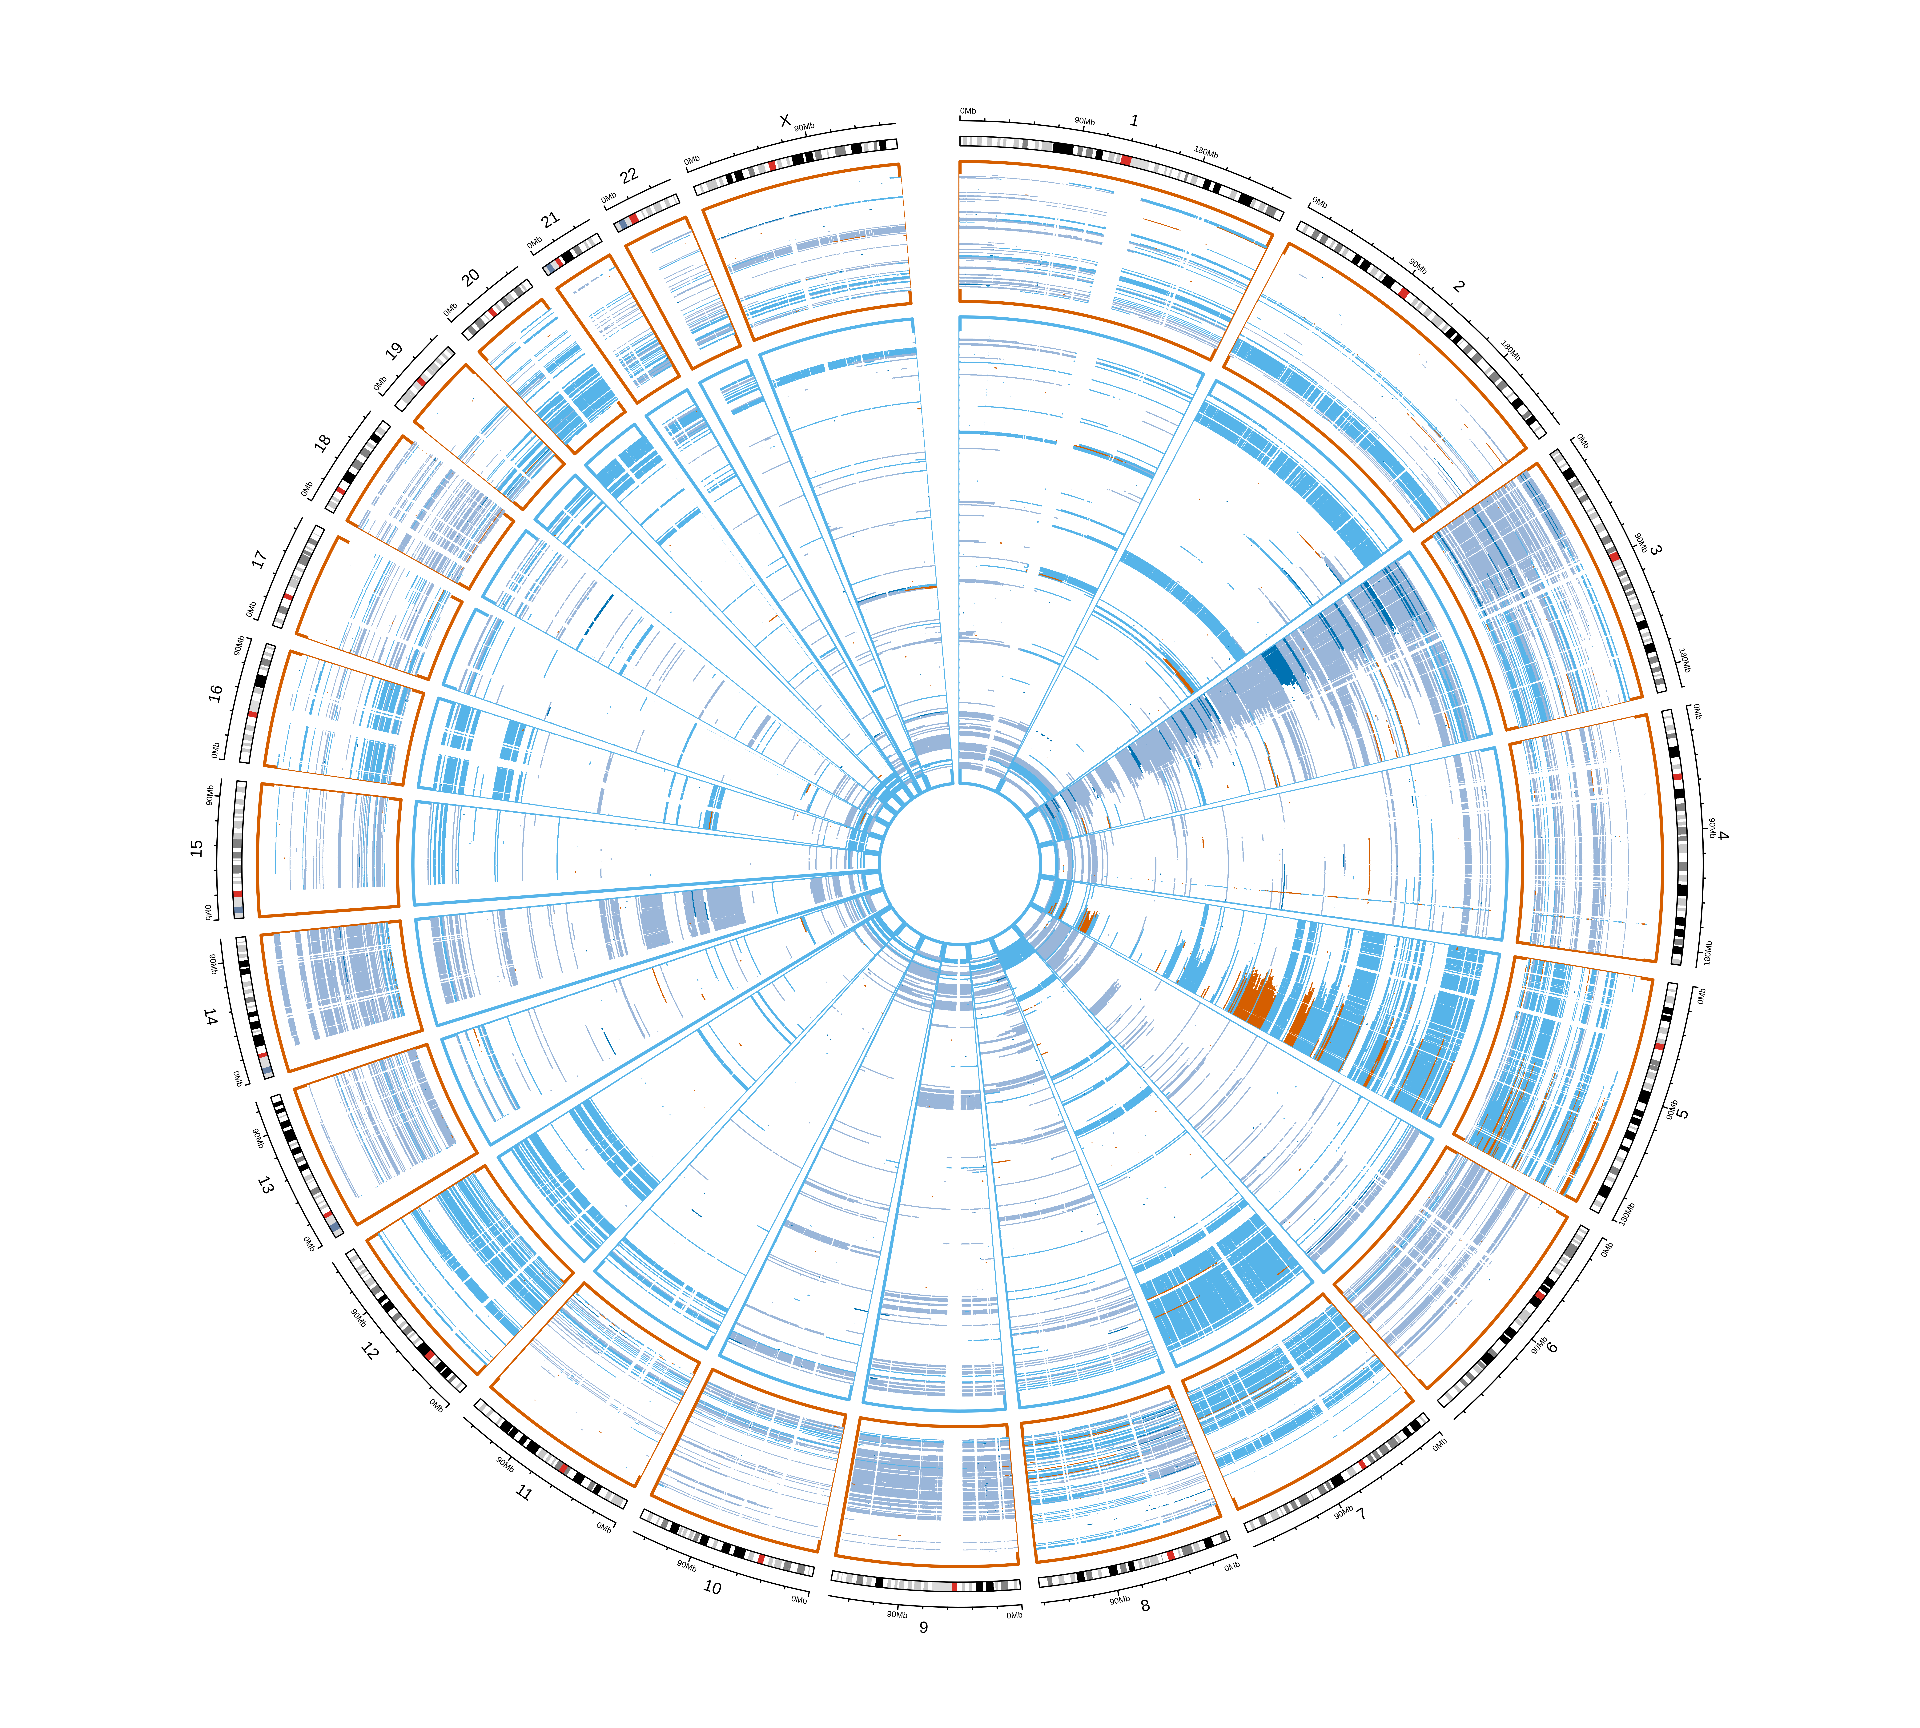
            used   (Mb) gc trigger   (Mb)   max used    (Mb)
Ncells  26005581 1388.9   43718764 2334.9   43718764  2334.9
Vcells 431665491 3293.4 1096133079 8362.9 1920414240 14651.6
used (Mb) gc trigger (Mb) max used (Mb)
Ncells 26003668 1388.8 43718764 2334.9 43718764 2334.9
Vcells 264573341 2018.6 876906464 6690.3 1920414240 14651.6
            used   (Mb) gc trigger   (Mb)   max used    (Mb)
Ncells  26005343 1388.9   43718764 2334.9   43718764  2334.9
Vcells 429110900 3273.9  876906464 6690.3 1920414240 14651.6
CNVs events seems to have similar patterns across the different kidney carcinomas, and between Factor 3 patients and the others. The only difference between Factor 3 and non-Factor 3 patients is the abundance of CNV events, rather than the presence of a signature associated with Factor 3. This analysis is obviously biased by the granularity of the CNV info available in TCGA while not having access to the restricted genomics data.
8.6 Somatic Mutations on Factor3 genes
Similarly to CNVs data, we have not included somatic mutation information in the multi-omics factor analysis that led to the identification of Factor 3 due to their data shape. However, we can test if any specfic somatic mutation is enriched in Factor 3 biopsies.
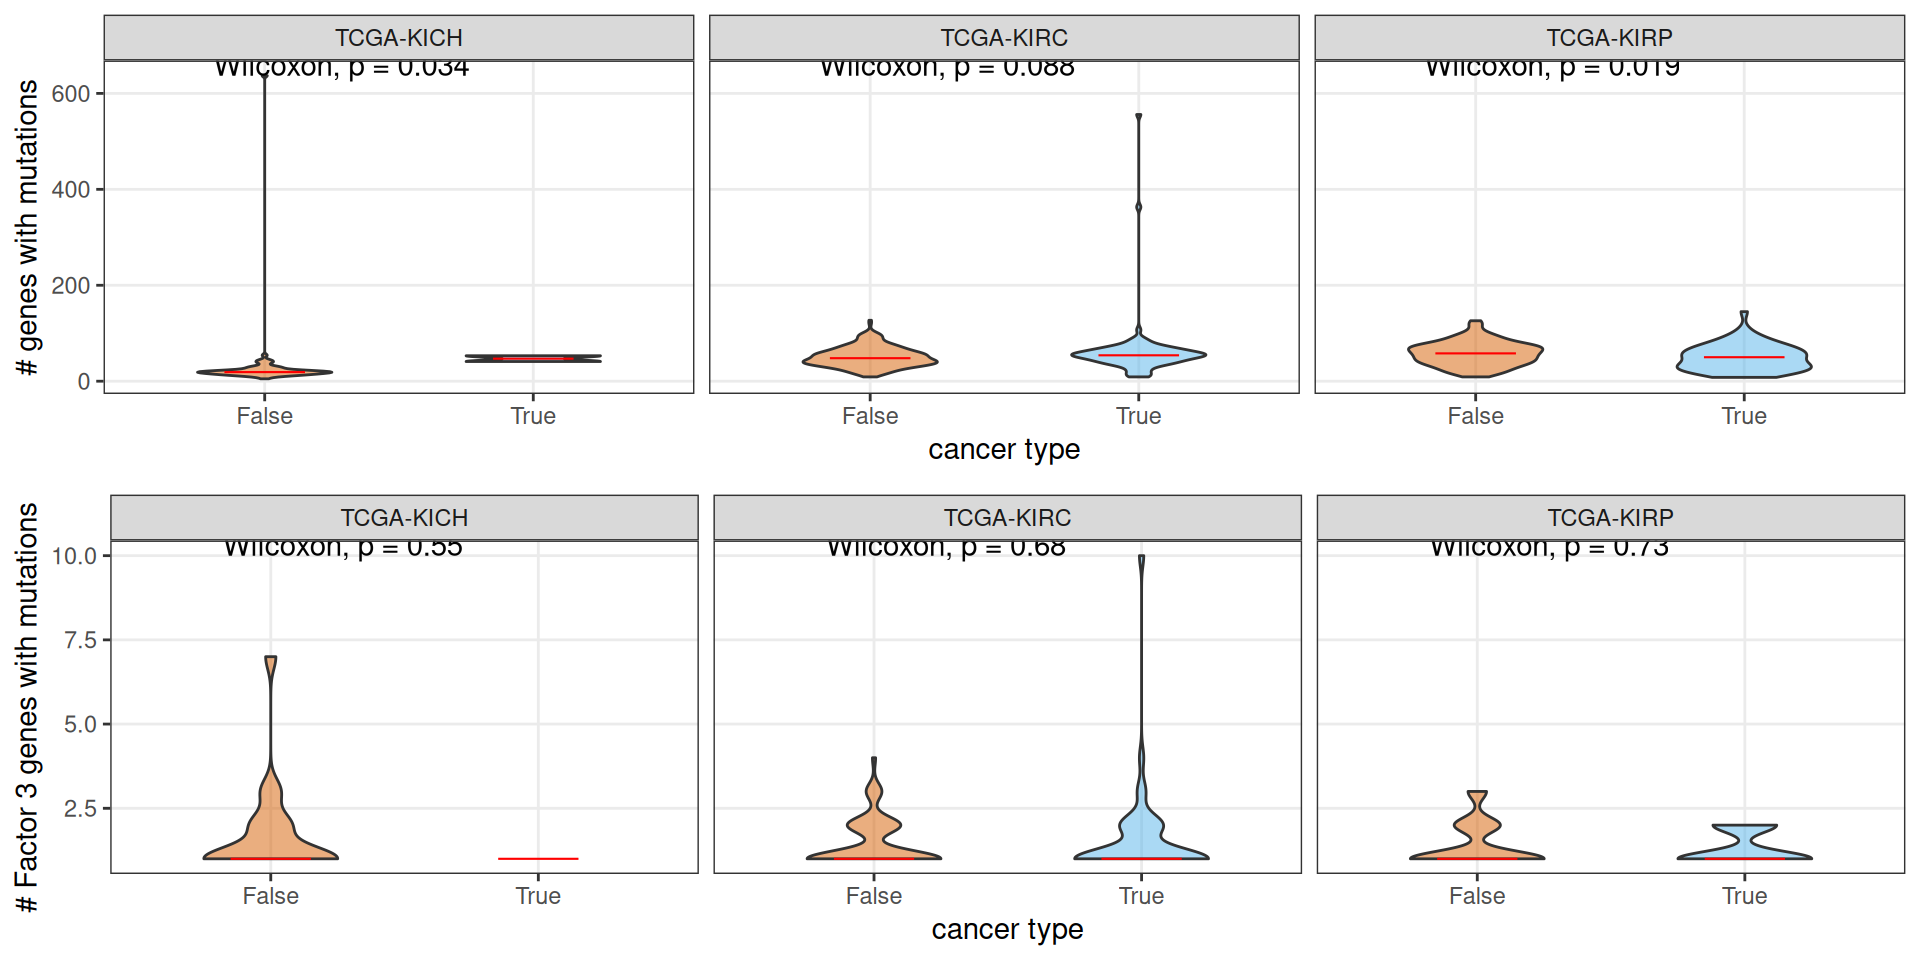
In our genomics analyses (see Chapter 5), we observed that KIRP patients have on average significantly higher genes with non-silent somatic mutations than KIRC and KICH patients, and also KIRC patients have on average significantly higher genes with non-silent somatic mutations than KICH patients. When we stratify the patients for Factor 3, we observe that, on average, KIRP Factor 3 patients have slighter less genes affected by somatic mutations than patients that are not Factor 3. There are no significant differences in KIRC patients, and the results from KICH patients is unreliable since it is based on a sample of n = 2. When looking at genes associated to Factor 3 from the multi-omics factor analysis, we see no significant differences between Factor 3 and non-Factor 3 patients.
8.6.1 Mutational signatures associated to Factor3
We can plot the distribution of non-silent somatic mutations across the genome of the patients stratified by Factor 3 and by kidney carcinoma. Factor 3 patients were not further stratified for KICH, since only 2 KICH patients belong to Factor 3.
            used   (Mb) gc trigger   (Mb)   max used    (Mb)
Ncells  26007286 1389.0   43718764 2334.9   43718764  2334.9
Vcells 277555275 2117.6  841894205 6423.2 1920414240 14651.6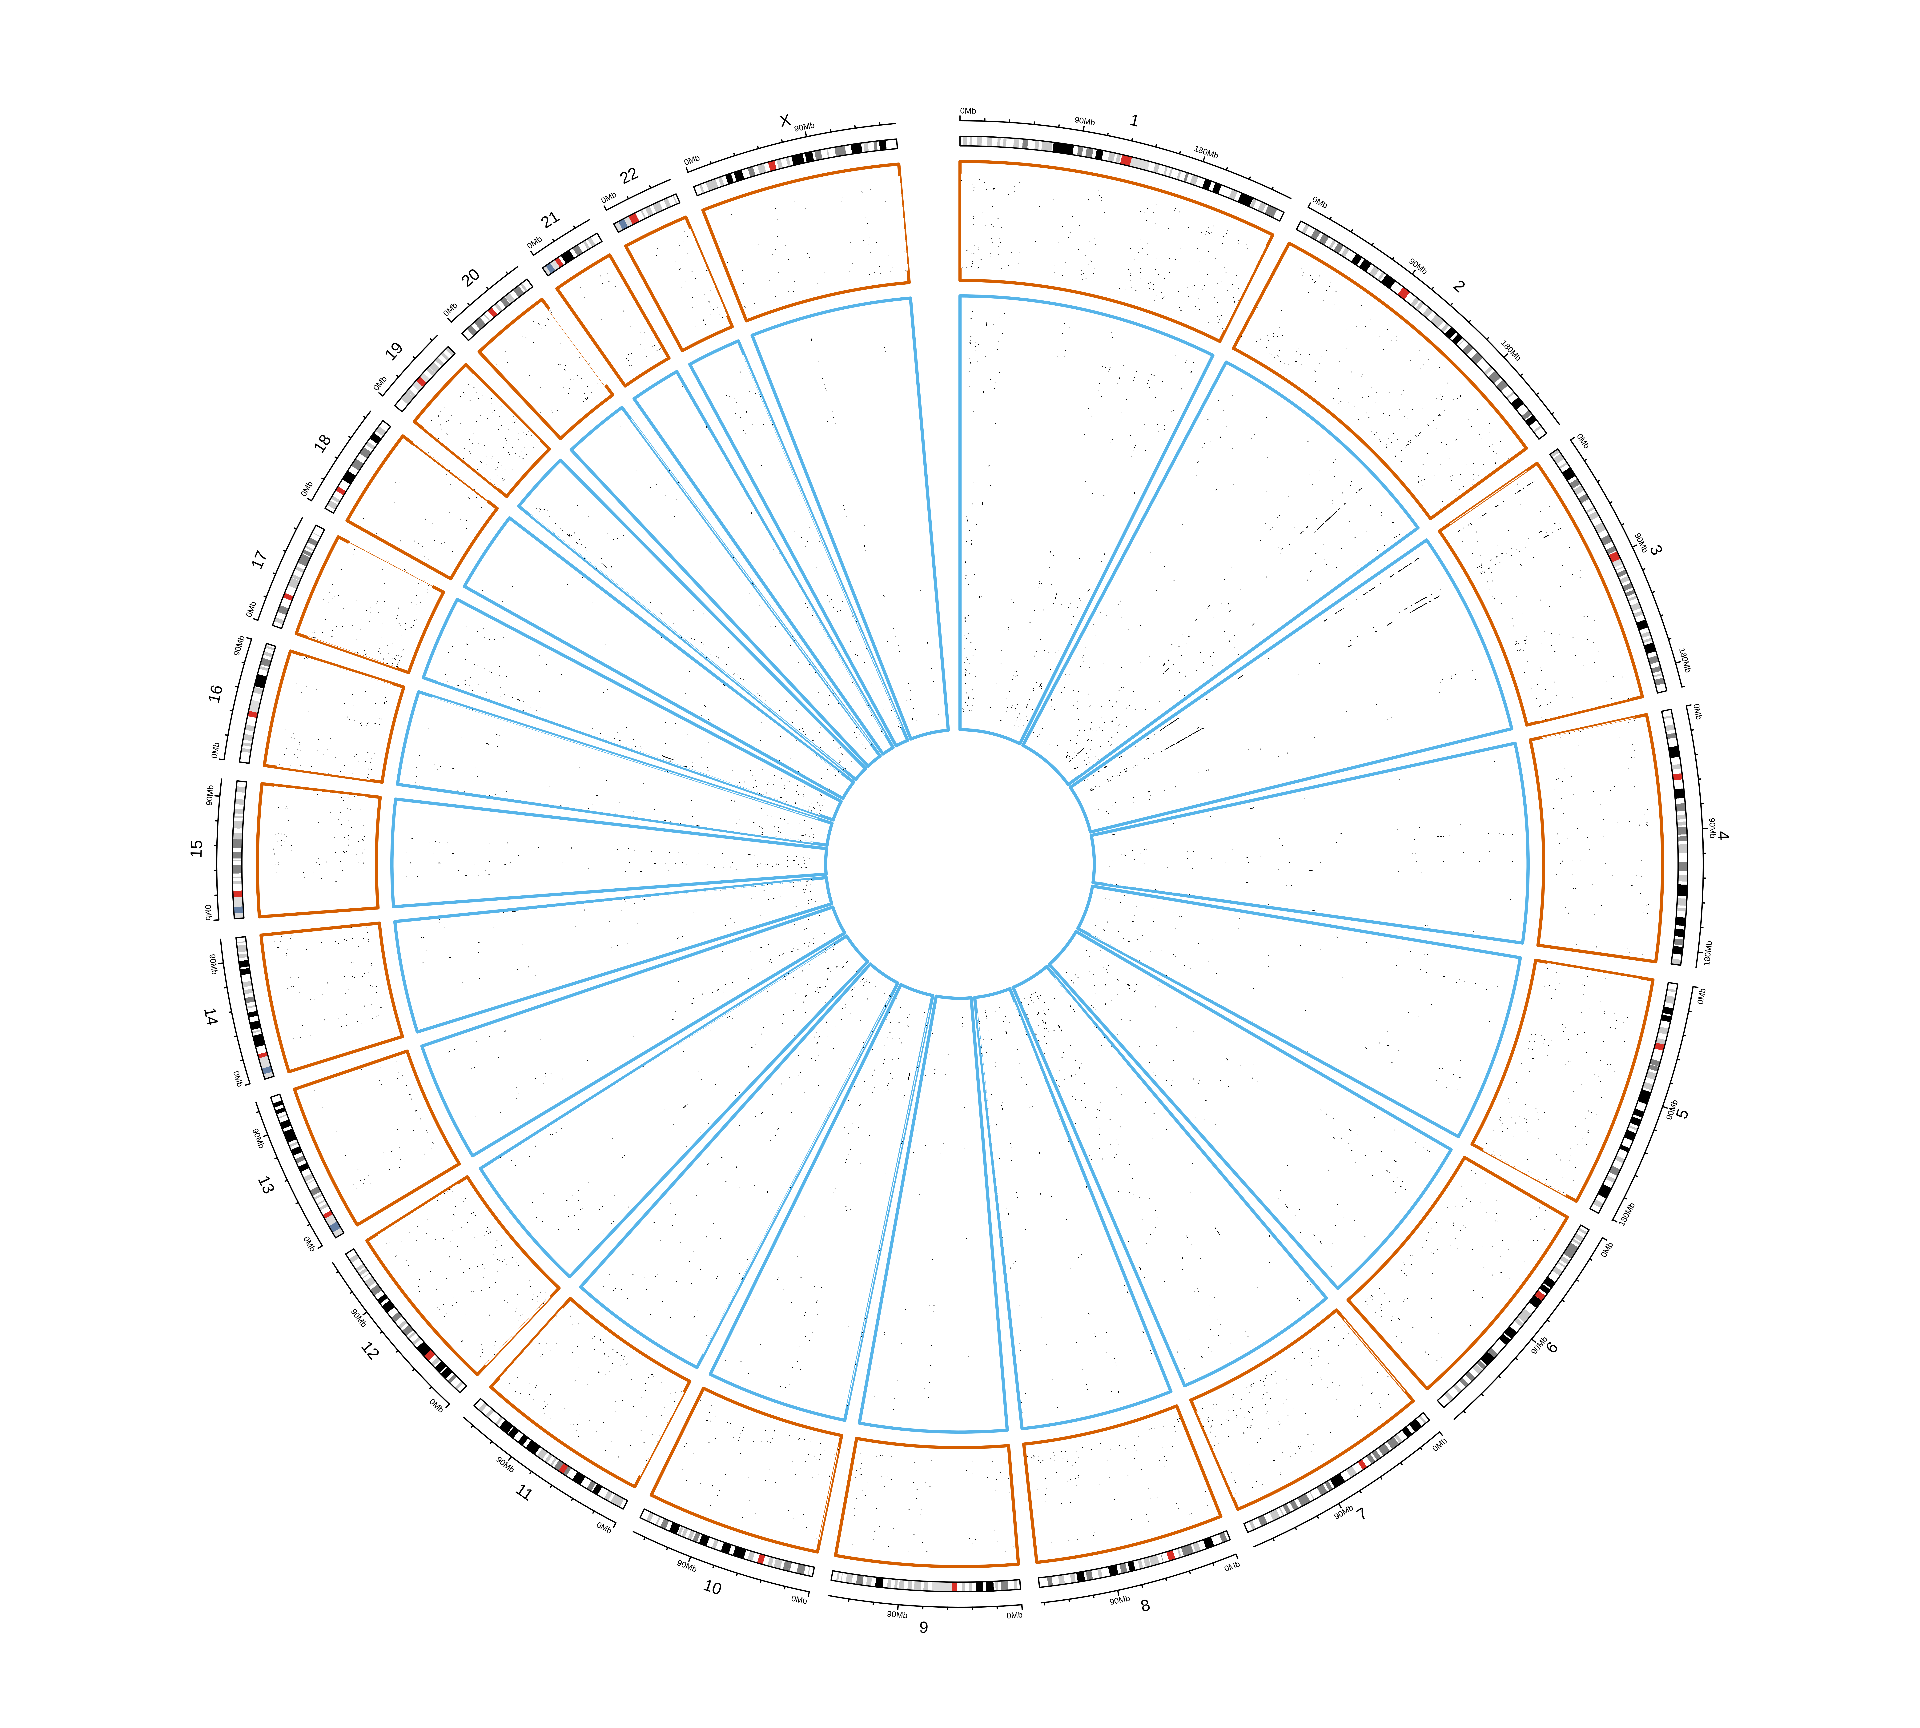
            used   (Mb) gc trigger   (Mb)   max used    (Mb)
Ncells  26008688 1389.1   43718764 2334.9   43718764  2334.9
Vcells 442092293 3372.9  841894205 6423.2 1920414240 14651.6
used (Mb) gc trigger (Mb) max used (Mb)
Ncells 26006241 1388.9 43718764 2334.9 43718764 2334.9
Vcells 273572280 2087.2 841894205 6423.2 1920414240 14651.6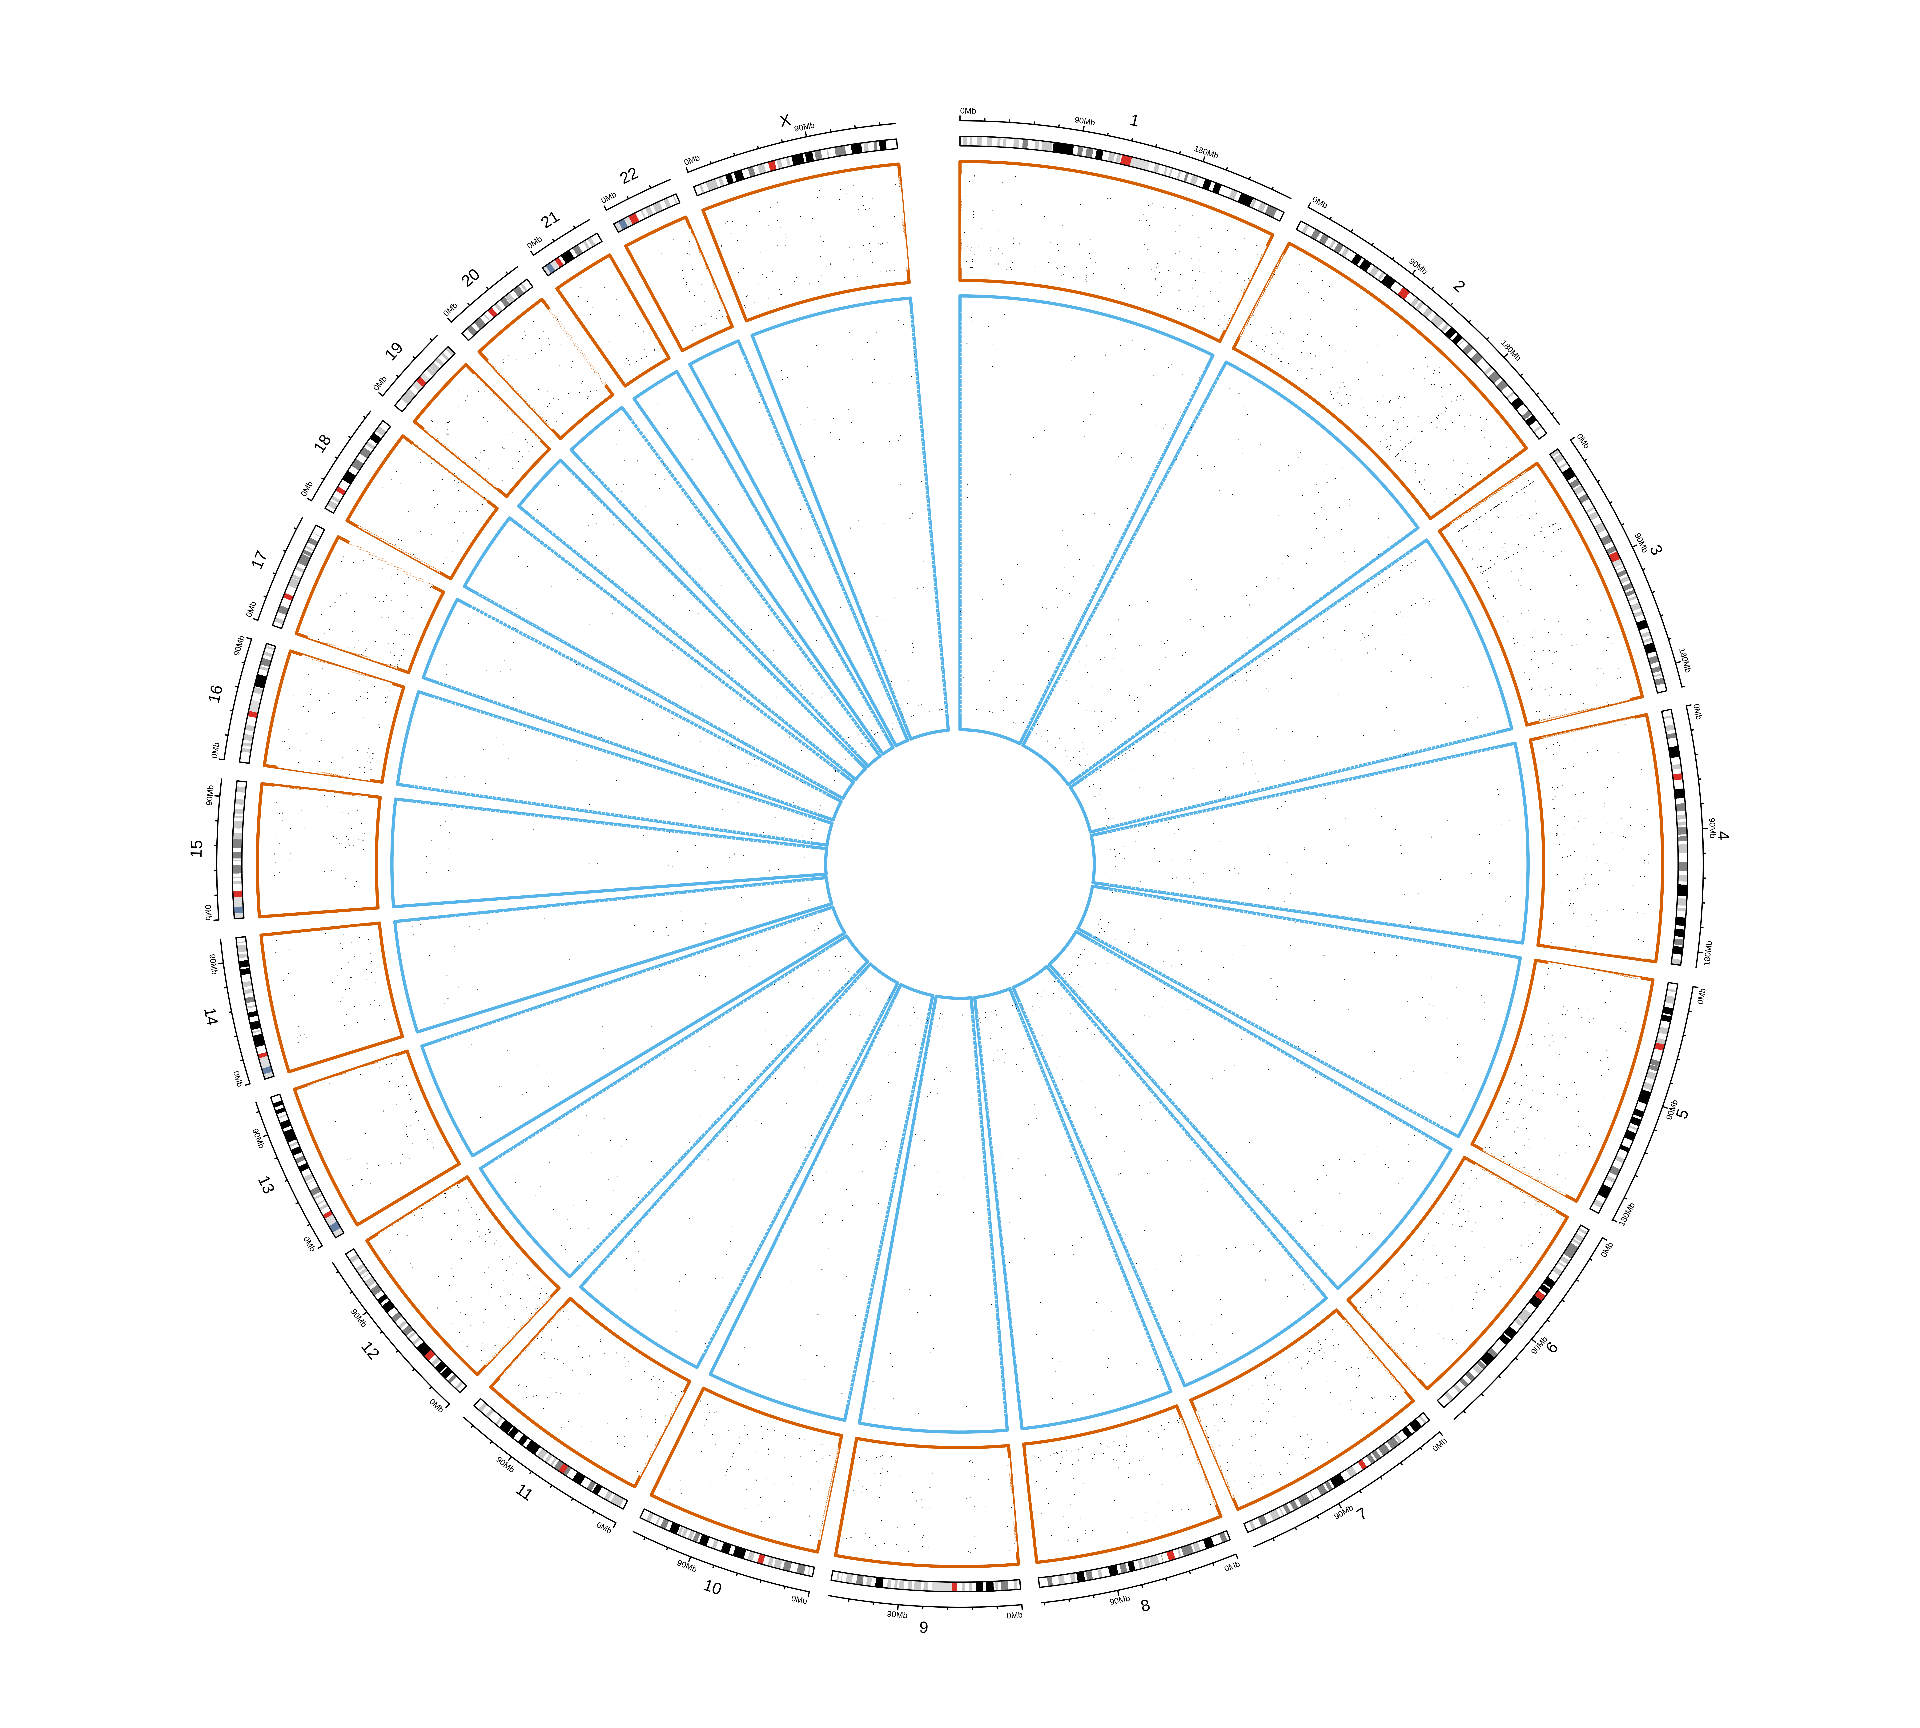
            used   (Mb) gc trigger   (Mb)   max used    (Mb)
Ncells  26007651 1389.0   43718764 2334.9   43718764  2334.9
Vcells 438109309 3342.6  841894205 6423.2 1920414240 14651.6
used (Mb) gc trigger (Mb) max used (Mb)
Ncells 26006173 1388.9 43718764 2334.9 43718764 2334.9
Vcells 272648963 2080.2 841894205 6423.2 1920414240 14651.6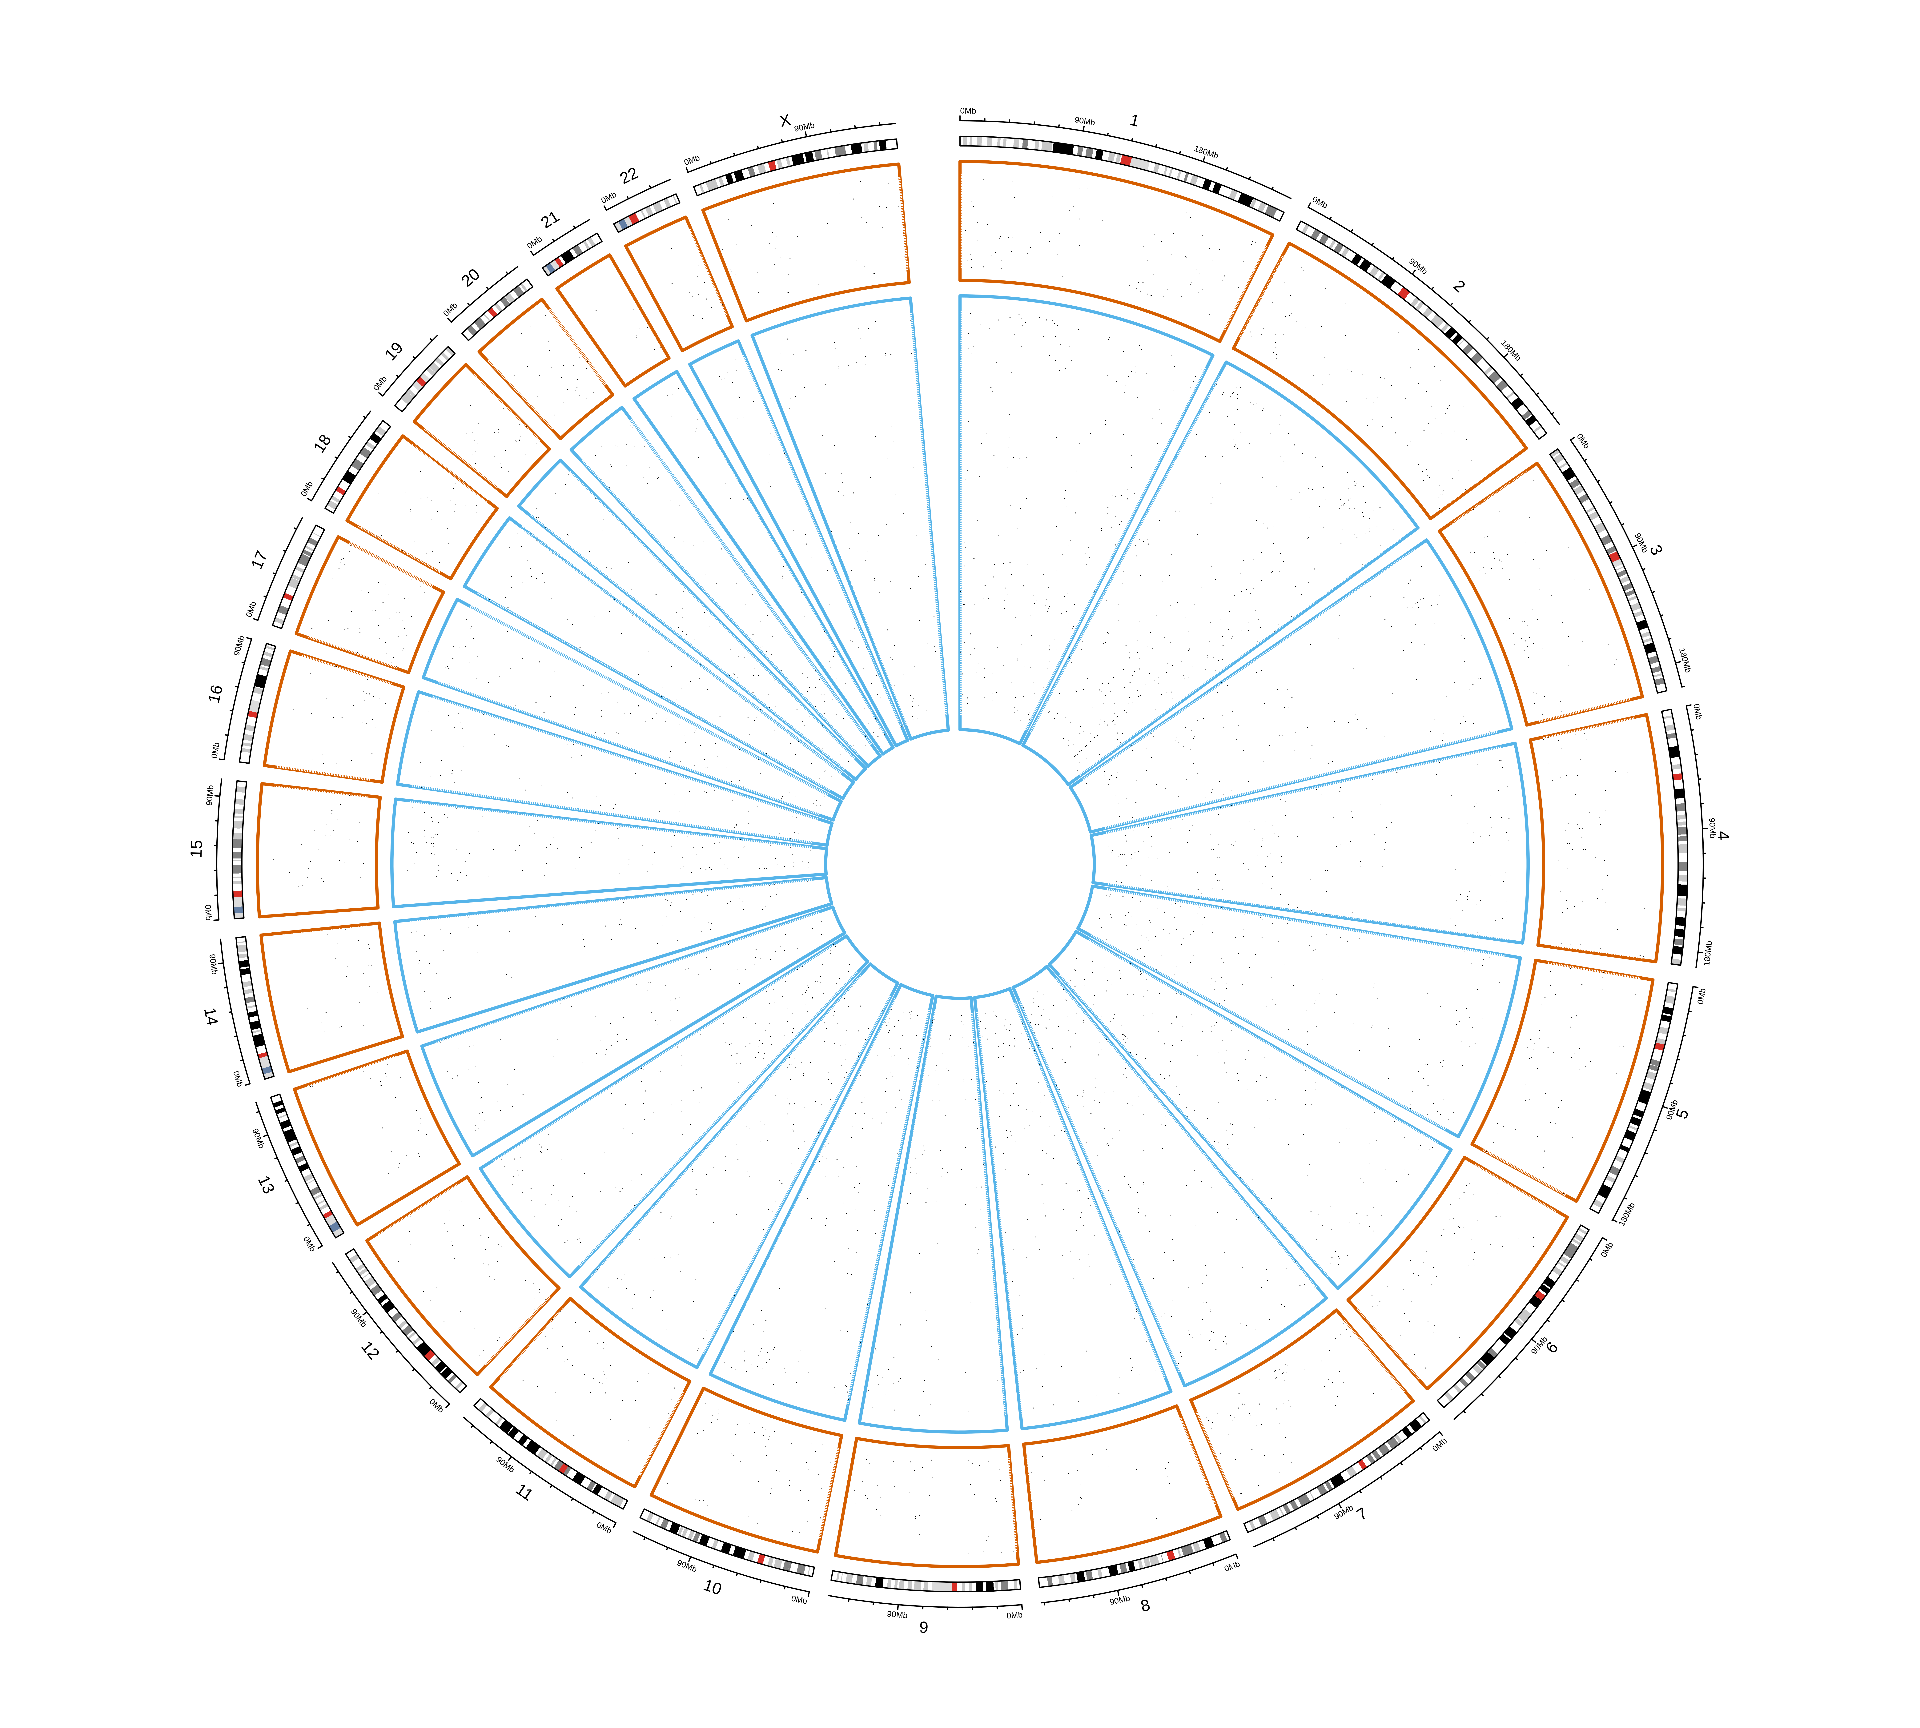
            used   (Mb) gc trigger   (Mb)   max used    (Mb)
Ncells  26007583 1389.0   43718764 2334.9   43718764  2334.9
Vcells 437185992 3335.5  841894205 6423.2 1920414240 14651.6
Looking at the non-silent somatic mutations distribution acros the genome, we can only spot a few genes that are consistently mutated in Factor 3 patients in chromosome 2 and chromosome 3 of KIRC patients. Since we cannot spot any other pattern looking at this general overview, let’s take a closer look a each gene and try identify somatic mutations associated with Factor 3.
For each gene, we compute the proportion of Factor 3 patients that have a somatic mutation in that gene, and the corresponding proportion of non-Factor 3 patients having somatic mutations in that gene. Then, we generate a mutation index by subtracting non-Factor 3 proportion from the Factor 3 proportion. If the mutation is more frequent in Factor 3 patients, we will obtain a positive mutation index. If the mutation has the same frequency in Factor 3 patients versus non-Factor 3 patients we would get exactly zero, if the mutation is less frequent in Factor 3 patients we would get a negative mutation index. A small positive mutation index is probably not significant, so we can also probably add two arbitrary threshold of 2 and 3 standard deviations above and below the mean mutation index (reported as red dotted and red dashed lines in the figures, respectively).
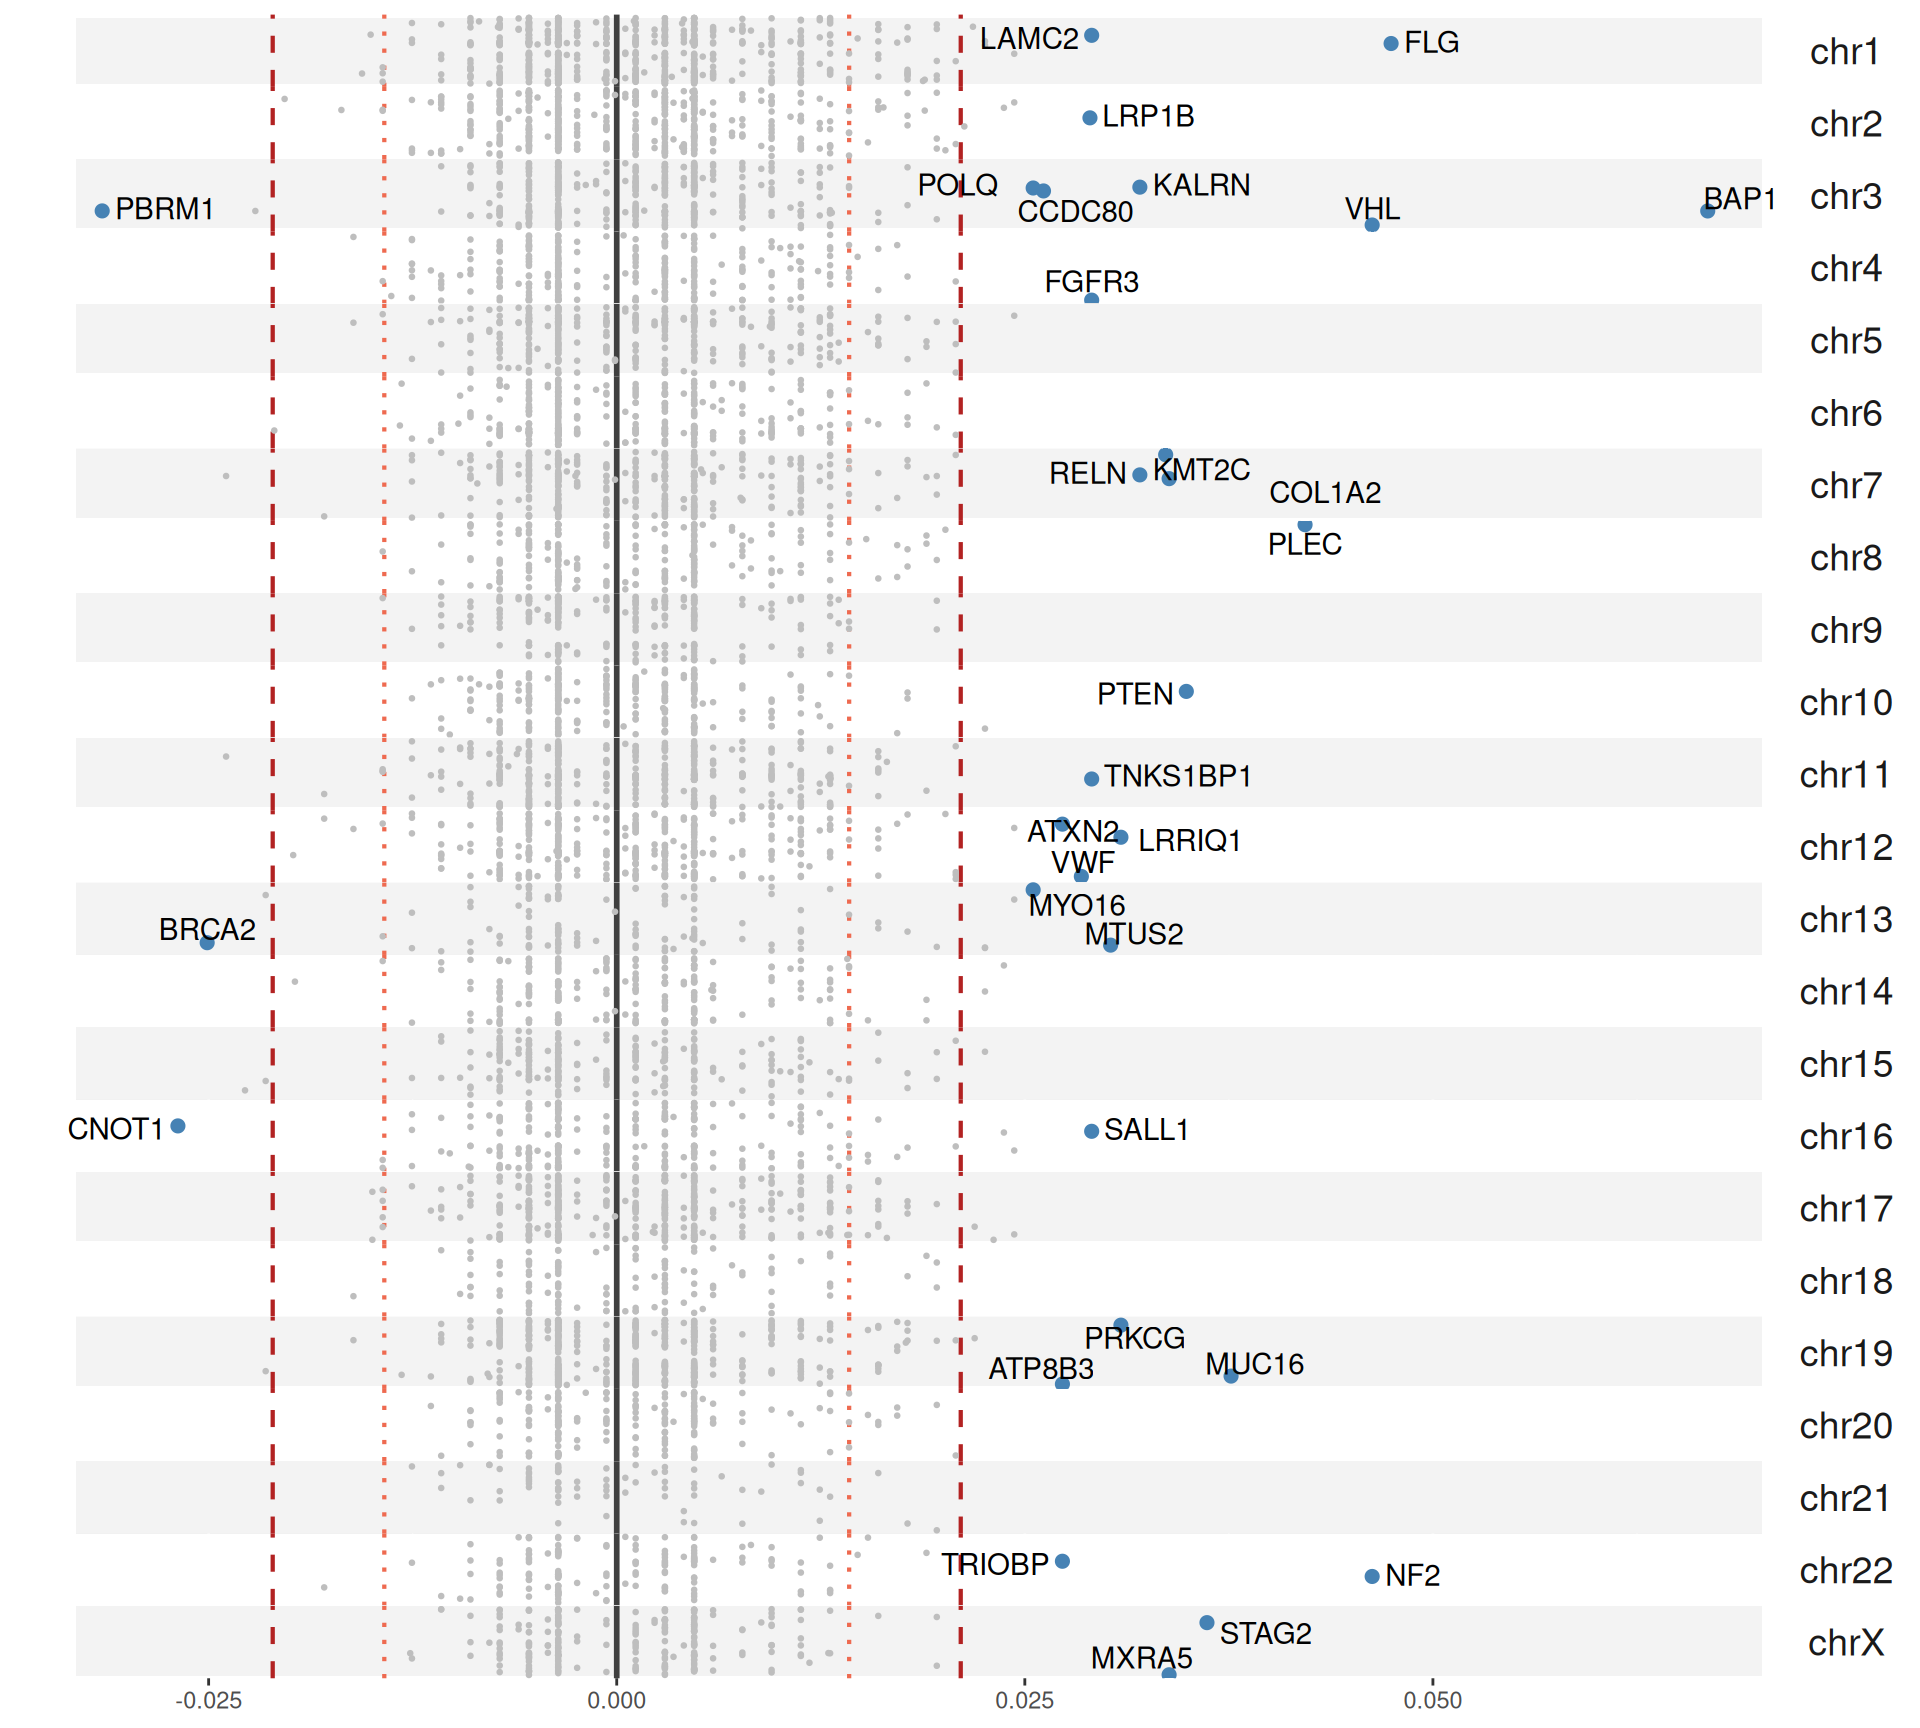
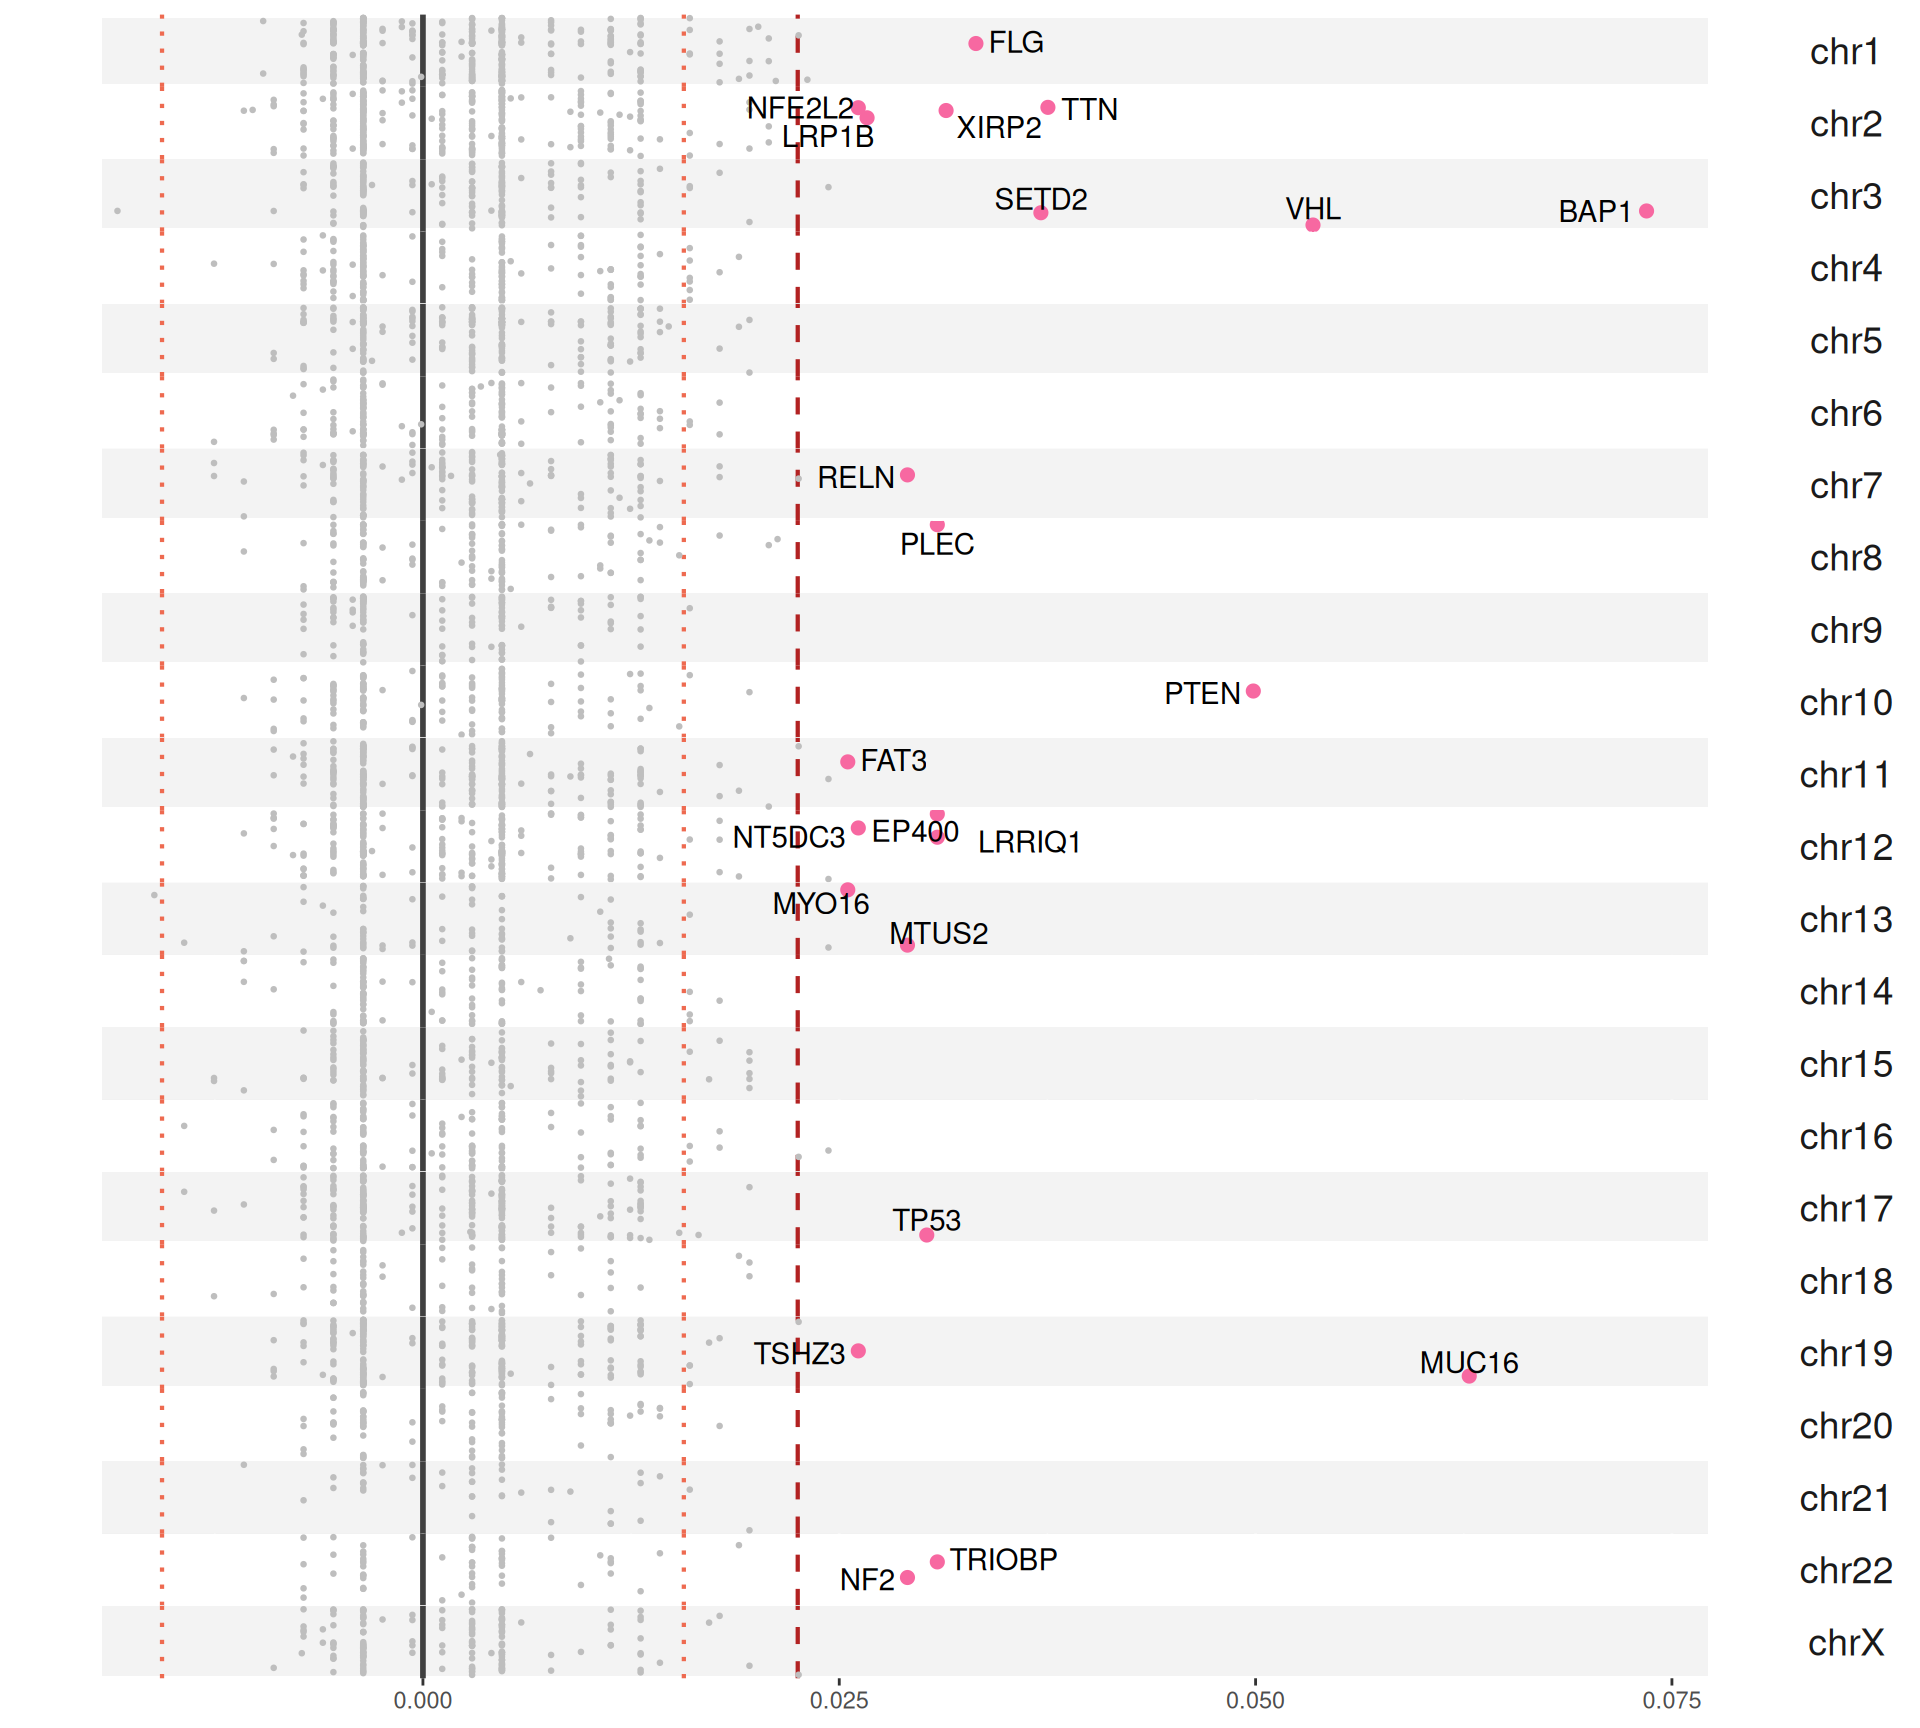
The Manhattan plot-style representation of the mutation index show us that indeed we have several genes with “significantly” high mutation index in chromosome 2 and chromosome 3 of the KIRC and KIRP and KIRC only cohorts, respectively.
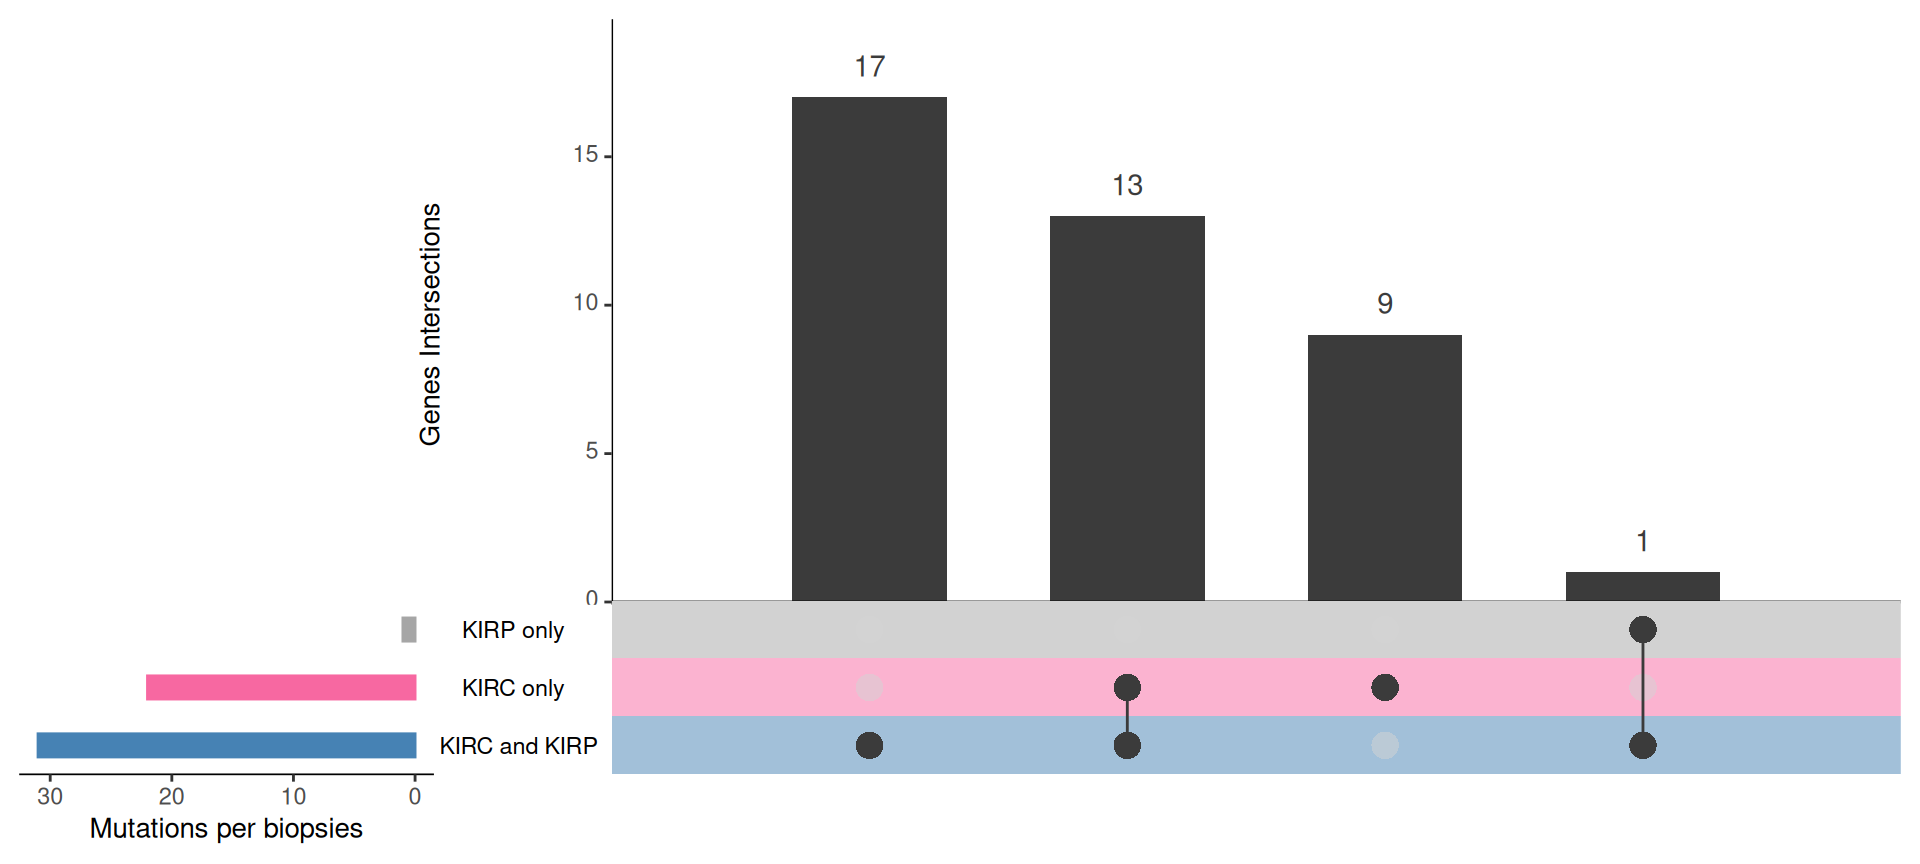
In total, we have 40 genes with a mutation index significantly different different from the mean in Factor 3 patients, with 37 genes being more mutated in Factor 3 patients and 3 genes being less mutated in Factor 3 patients.
For the 37 genes being more mutated in Factor 3 patients:
- We can observe 31 of them in the KIRC+KIRP combined cohort:
- 17 are unique to the KIRC+KIRP cohort itself: ATP8B3, CCDC80, COL1A2, KALRN, LAMC2, MXRA5, POLQ, PRKCG, SALL1, STAG2, TNKS1BP1, VWF.
- Spalt Like Transcription Factor 1 SALL1 has a fundamental role in kidney development, and it is a known tumor suppressor in breast cancer.
- STAG2 Cohesin Complex Component is commonly mutated in several kind of cancers.
- Von Willebrand factor VWF promote pro‐inflammatory signaling, regulate angiogenesis and vascular permeability and can mediate cancer progression and metastasis.
- 13 are in common with the KIRC only cohort: BAP1, FLG, LRP1B, LRRIQ1, MTUS2, MUC16, MYO16, NF2, PLEC, PTEN, RELN, TRIOBP, VHL.
- BRCA-1 Associated Protein-1 BAP1 is frequently mutated in kidney cancers. In our genomics analyses resulted the 5th most mutated gene in KIRC and the 10th most mutated gene in KIRP (see Chapter 5). BAP1 mutations are associated with cancer aggressiveness, inflammation, and possibly a heightened response to immunotherapy.
- Mucin 16, Cell Surface Associated MUC16 was the 6th most mutated gene in KIRC and the second one in KIRP.
- Phosphatase And Tensin Homolog PTEN is associated with worse OS in kidney cancer.
- Von Hippel-Lindau Tumor Suppressor VHL is the most mutated gene in KIRC patients, and VHL mutation is an hallmark of KIRC.
- 1 is in common wiht the KIRP only cohort.
- 17 are unique to the KIRC+KIRP cohort itself: ATP8B3, CCDC80, COL1A2, KALRN, LAMC2, MXRA5, POLQ, PRKCG, SALL1, STAG2, TNKS1BP1, VWF.
- We can observe 22 of them in the KIRC cohort:
- 13 are in common with the KIRC+KIRP combined cohort.
- 9 are unique to the KIRC cohort itself: EP400, FAT3, NFE2L2, NT5DC3, SETD2, TP53, TSHZ3, TTN, XIRP2.
- SET Domain Containing 2, Histone Lysine Methyltransferase SETD2 was the 4th most mutated gene in KIRC and the 5th in KIRP, and SETD2 mutations are associated with a significant increase on metastatic potential of KIRC cancers.
- Tenascin N TNN is the third most mutated gene in KIRC and the most mutated on ein KIRP.
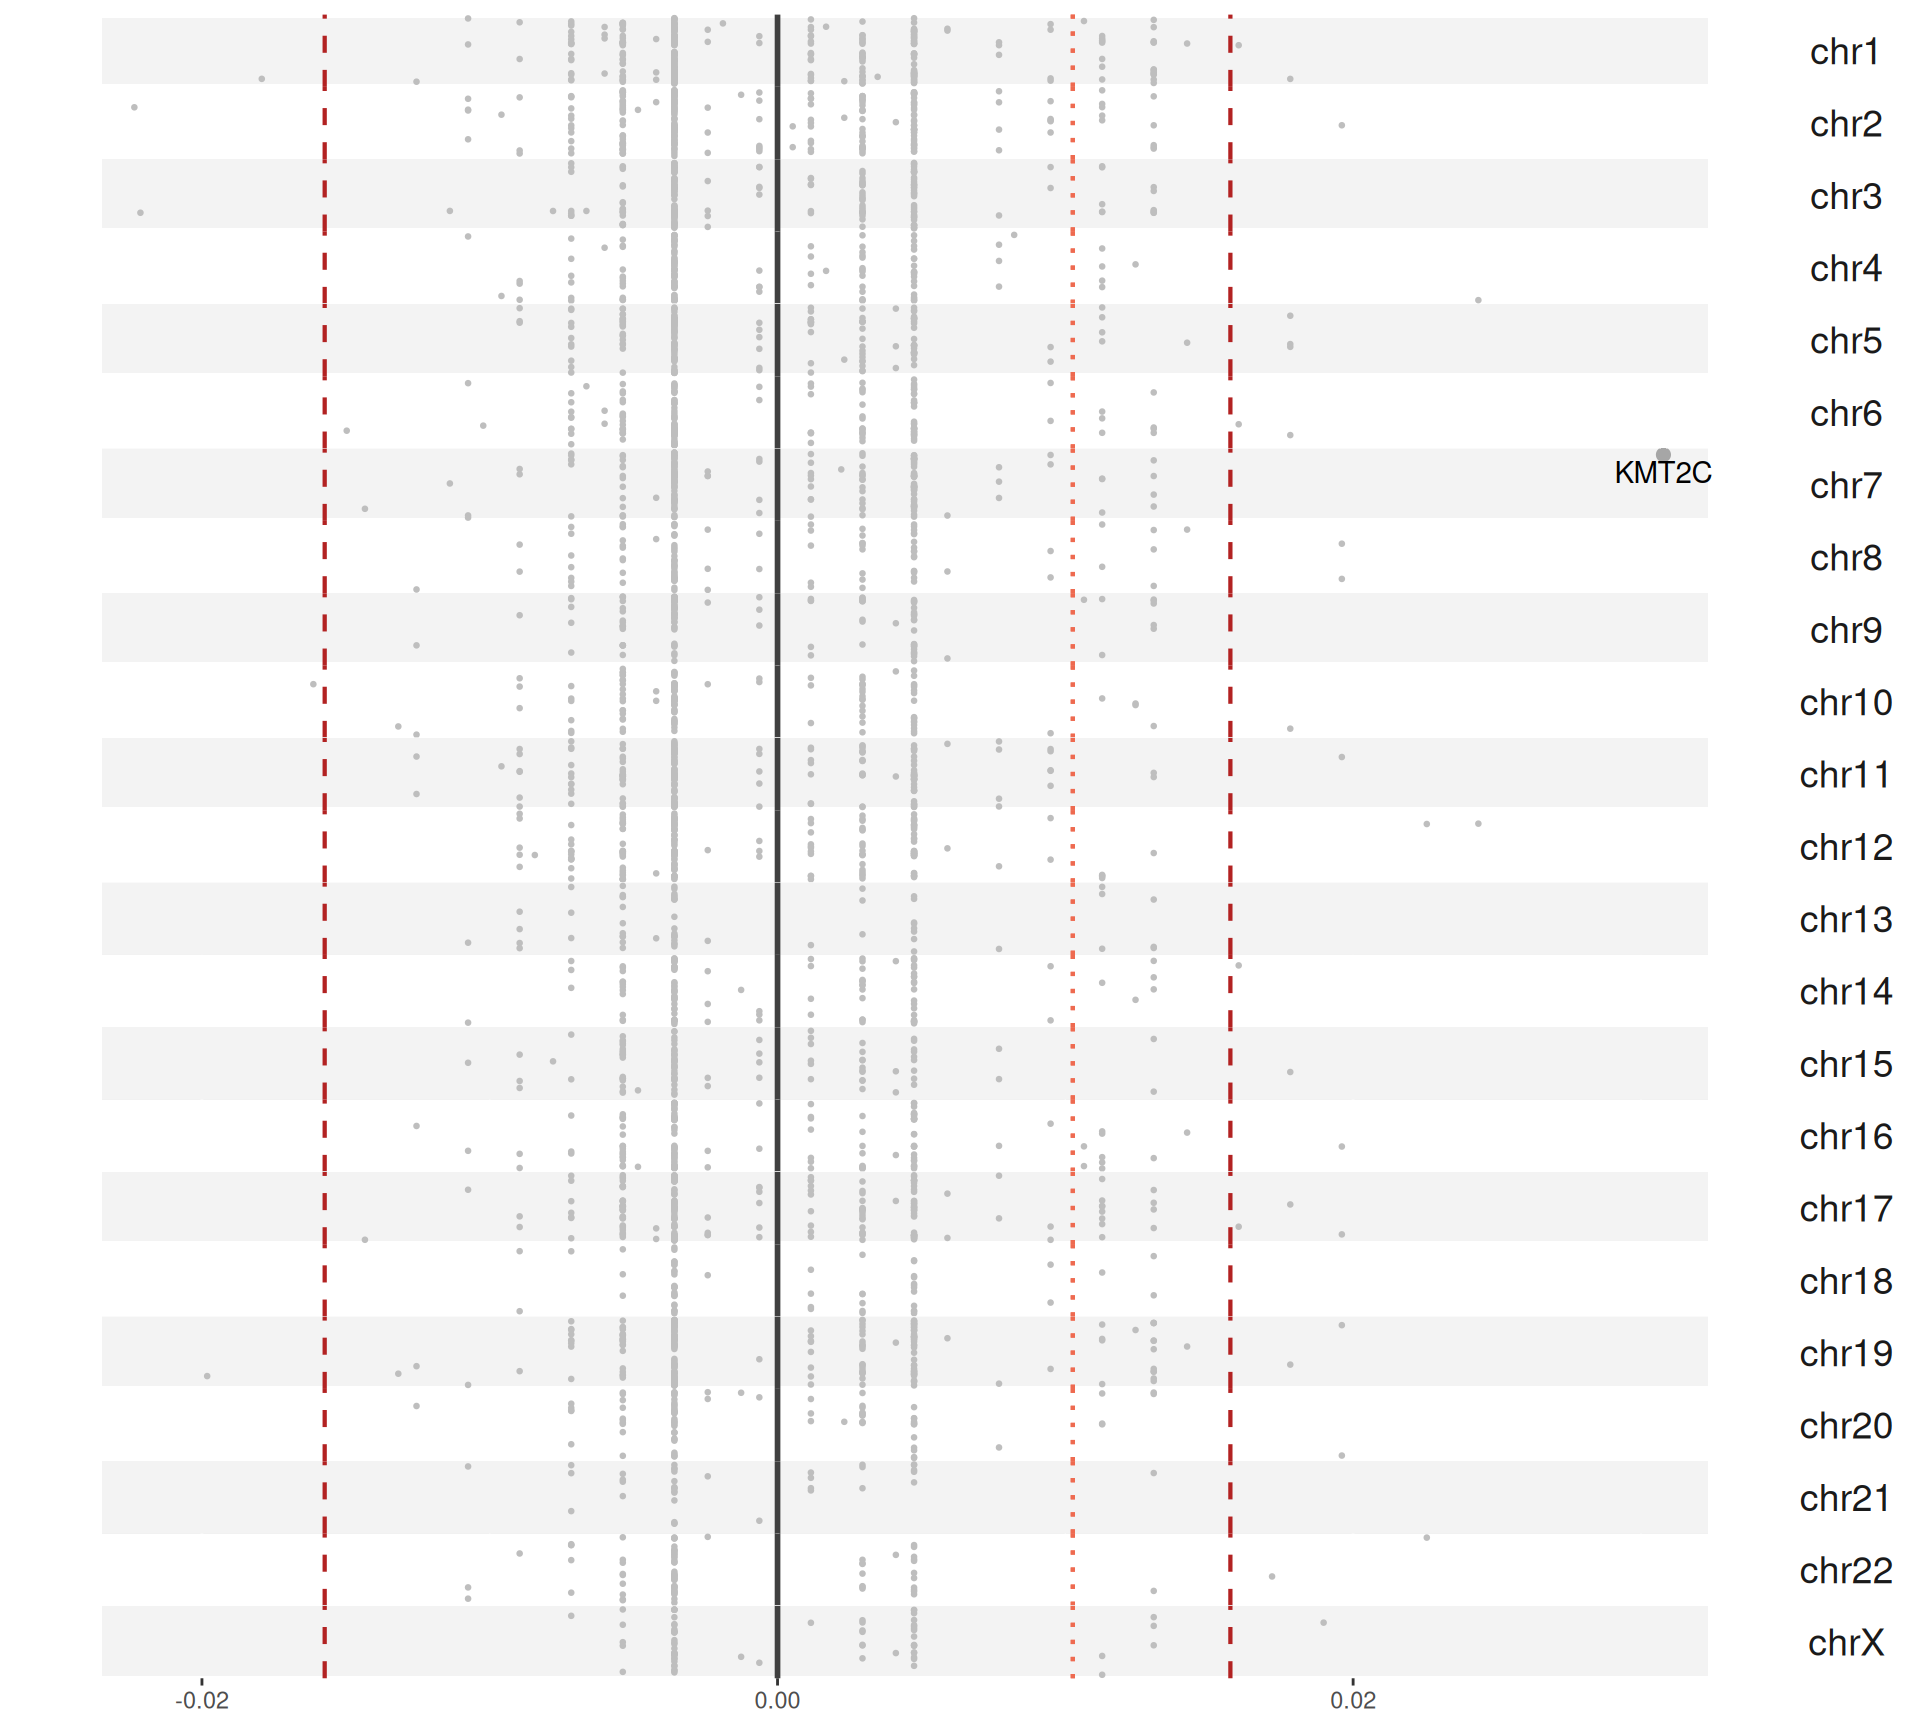
- Only Lysine Methyltransferase 2C KMT2C appear in the KIRP cohort alone (and we can observe it in the combined KIRC+KIRP cohort as well). Mutations on KMT2C is associated with acquired cystic disease-associated renal cell carcinomas (ACD-RCCs), but little information is available on its prognostic value.
The 3 genes that are less mutated in Factor 3 patients appear to be significant when we consider KIRC and KIRP patients together. This observation is puzzling and difficult to interpret without access to more info on the actual mutation. The affected genes are:
- BRCA2 DNA Repair Associated: BRCA2 is a known oncogene, but its role on kidney carcinomas is yet to be clarified, so this observation is of difficult interpretation, expecially when we cannot confirm that all the patients exaclty the same somatic mutation.
- CCR4-NOT Transcription Complex Subunit 1, CNOT1: CNOT1 gene expression has been already associated with a more favourable prognosis from a similar analyses always in the TCGA KIRC cohort.
- Polybromo 1 PBRM1: this gene encodes for a subunit of ATP-dependent chromatin-remodeling complexes. A review on PBRM1 predictive and prognostic value in kidney carcinomas reported that patients associated to a PBRM1-mutant group showed superior median OS than the ones associated to a BAP1-mutant group. Notacibly, PBMR1 is also the second most abundant mutated gene in KIRC in general, with ~40% of KIRC patients (145 / 365) that presented non-silent somatic mutations in it (see Chapter 5).
8.7 Lessons Learnt
Based on the characterization of Factor 3 patients, we have learnt:
- From the overrepresentation analysis, we observe that:
- Factor 3 is not overrepresented in KIRC or KIRP, but it is underrepresented in KICH.
- Factor 3 is overrepresented in patients that died and in patients with residual disease.
- Factor 3 is porportionally overrepresented in more advanced tumours according to the tumor staging, pathological grade and histological grade.
- Looking at the multi-omics features, we observe that:
- Factor 3 patients have a peculiar transcriptomics and micro-RNA profile, which also seems shared with other non-Factor 3 KIRC patients with tumors with higher histological grade.
- Factor 3 patients had a distinct proteomics signature, with Plasminogen activator inhibitor-1 PAI1 protein having the most absolute weight.
- The gene interaction network we have reconstructed from the multi-omics features suggests that Factor 3 patients had a strong activation of the complement cascade, a pro-inflammatory tumor micro-environment with lost of kidney differentiation and strong epithelial-mesenchymal transition.
- Characterization of Factor 3 patients tumor microenvironment suggest an immuno-activated microenvironment with immuno-evasive features.
- From the genomics data we observed that:
- KIRC Factor 3 patients have significant higher genes with CNV events than non-Factor 3 patients. This increase in CNV is not observed in Factor 3 KIRP patients.
- Factor 3 patients do not appear to have a significantly higher mutation burder. However, we identified several genes that have significantly higher mutation index in Factor 3 patients when compared to non-Factor 3 patients. Among these genes were included known tumor suppressor genes and known biomarkers for worse outcome in Kidney cancers and other types of tumors, including BAP1, MUC16, PTEN, SALL1, SETD2, STAG2, VHL, VWF.
8.8 Session Information
Note
R version 4.3.3 (2024-02-29)
Platform: x86_64-pc-linux-gnu (64-bit)
Running under: Ubuntu 24.04.3 LTS

Matrix products: default
BLAS:   /usr/lib/x86_64-linux-gnu/blas/libblas.so.3.12.0
LAPACK: /usr/lib/x86_64-linux-gnu/lapack/liblapack.so.3.12.0

locale:
 [1] LC_CTYPE=en_US.UTF-8    LC_NUMERIC=C            LC_TIME=C
 [4] LC_COLLATE=en_US.UTF-8  LC_MONETARY=C           LC_MESSAGES=en_US.UTF-8
 [7] LC_PAPER=C              LC_NAME=C               LC_ADDRESS=C
[10] LC_TELEPHONE=C          LC_MEASUREMENT=C        LC_IDENTIFICATION=C

time zone: Europe/Brussels
tzcode source: system (glibc)

attached base packages:
 [1] parallel  grid      stats4    stats     graphics  grDevices utils
 [8] datasets  methods   base

other attached packages:
 [1] vcd_1.4-13
 [2] UpSetR_1.4.0
 [3] umap_0.2.10.0
 [4] stringr_1.5.1
 [5] scales_1.4.0
 [6] RColorBrewer_1.1-3
 [7] qs_0.27.3
 [8] PCAtools_2.14.0
 [9] missMethyl_1.36.0
[10] IlluminaHumanMethylationEPICanno.ilm10b4.hg19_0.6.0
[11] mCSEA_1.22.0
[12] Homo.sapiens_1.3.1
[13] TxDb.Hsapiens.UCSC.hg19.knownGene_3.2.2
[14] GO.db_3.18.0
[15] OrganismDbi_1.44.0
[16] GenomicFeatures_1.54.4
[17] mCSEAdata_1.22.0
[18] org.Hs.eg.db_3.18.0
[19] IlluminaHumanMethylation450kanno.ilmn12.hg19_0.6.1
[20] minfi_1.48.0
[21] bumphunter_1.44.0
[22] locfit_1.5-9.12
[23] iterators_1.0.14
[24] foreach_1.5.2
[25] Biostrings_2.70.3
[26] XVector_0.42.0
[27] SummarizedExperiment_1.32.0
[28] MatrixGenerics_1.14.0
[29] matrixStats_1.5.0
[30] Gviz_1.46.1
[31] gridExtra_2.3
[32] ggpubr_0.6.1
[33] ggraph_2.2.1
[34] GenomicRanges_1.54.1
[35] GenomeInfoDb_1.38.8
[36] forcats_1.0.0
[37] EnhancedVolcano_1.20.0
[38] ggrepel_0.9.6
[39] ggplot2_3.5.2
[40] edgeR_4.0.16
[41] limma_3.58.1
[42] DT_0.33
[43] dplyr_1.1.4
[44] DOSE_3.28.2
[45] DMRcate_2.16.1
[46] data.table_1.17.8
[47] cowplot_1.2.0
[48] clusterProfiler_4.10.1
[49] circlize_0.4.16
[50] BiocSingular_1.18.0
[51] BiocParallel_1.36.0
[52] AnnotationDbi_1.64.1
[53] IRanges_2.36.0
[54] S4Vectors_0.40.2
[55] Biobase_2.62.0
[56] BiocGenerics_0.48.1

loaded via a namespace (and not attached):
  [1] igraph_2.1.4                  graph_1.80.0
  [3] Formula_1.2-5                 zlibbioc_1.48.2
  [5] tidyselect_1.2.1              rvest_1.0.4
  [7] bit_4.6.0                     doParallel_1.0.17
  [9] clue_0.3-66                   lattice_0.22-5
 [11] rjson_0.2.23                  nor1mix_1.3-3
 [13] blob_1.2.4                    rngtools_1.5.2
 [15] S4Arrays_1.2.1                base64_2.0.2
 [17] dichromat_2.0-0.1             scrime_1.3.5
 [19] png_0.1-8                     cli_3.6.5
 [21] ggplotify_0.1.2               ProtGenerics_1.34.0
 [23] askpass_1.2.1                 multtest_2.58.0
 [25] openssl_2.3.3                 doSNOW_1.0.20
 [27] BiocIO_1.12.0                 purrr_1.1.0
 [29] basilisk.utils_1.14.1         uwot_0.2.3
 [31] shadowtext_0.1.5              curl_6.4.0
 [33] mime_0.13                     evaluate_1.0.4
 [35] tidytree_0.4.6                ComplexHeatmap_2.18.0
 [37] stringi_1.8.7                 backports_1.5.0
 [39] XML_3.99-0.18                 lubridate_1.9.4
 [41] httpuv_1.6.16                 magrittr_2.0.3
 [43] OmnipathR_3.10.1              rappdirs_0.3.3
 [45] splines_4.3.3                 mclust_6.1.1
 [47] RApiSerialize_0.1.4           KMsurv_0.1-6
 [49] jpeg_0.1-11                   doRNG_1.8.6.2
 [51] survminer_0.5.0               logger_0.4.0
 [53] corrplot_0.95                 lpSolve_5.6.23
 [55] bsseq_1.38.0                  DBI_1.2.3
 [57] HDF5Array_1.30.1              reactome.db_1.86.2
 [59] jquerylib_0.1.4               genefilter_1.84.0
 [61] withr_3.0.2                   class_7.3-22
 [63] enrichplot_1.22.0             lmtest_0.9-40
 [65] RBGL_1.78.0                   tidygraph_1.3.1
 [67] rtracklayer_1.62.0            BiocManager_1.30.26
 [69] htmlwidgets_1.6.4             fs_1.6.6
 [71] biomaRt_2.58.2                labeling_0.4.3
 [73] SparseArray_1.2.4             cellranger_1.1.0
 [75] annotate_1.80.0               reticulate_1.43.0
 [77] VariantAnnotation_1.48.1      zoo_1.8-14
 [79] knitr_1.50                    beanplot_1.3.1
 [81] timechange_0.3.0              patchwork_1.3.1
 [83] ggtree_3.10.1                 rhdf5_2.46.1
 [85] quantreg_6.1                  R.oo_1.27.1
 [87] RSpectra_0.16-2               irlba_2.3.5.1
 [89] gridGraphics_0.5-1            lazyeval_0.2.2
 [91] yaml_2.3.10                   maxstat_0.7-26
 [93] survival_3.8-3                BiocVersion_3.18.1
 [95] crayon_1.5.3                  tidyr_1.3.1
 [97] tweenr_2.0.3                  later_1.4.2
 [99] codetools_0.2-19              base64enc_0.1-3
[101] GlobalOptions_0.1.2           KEGGREST_1.42.0
[103] Rtsne_0.17                    shape_1.4.6.1
[105] ReactomePA_1.46.0             Rsamtools_2.18.0
[107] filelock_1.0.3                foreign_0.8-86
[109] pkgconfig_2.0.3               xml2_1.3.8
[111] GenomicAlignments_1.38.2      aplot_0.2.8
[113] BSgenome_1.70.2               ape_5.8-1
[115] viridisLite_0.4.2             biovizBase_1.50.0
[117] xtable_1.8-4                  interp_1.1-6
[119] car_3.1-3                     plyr_1.8.9
[121] httr_1.4.7                    tools_4.3.3
[123] htmlTable_2.4.3               broom_1.0.9
[125] checkmate_2.3.2               nlme_3.1-164
[127] selectr_0.4-2                 HDO.db_0.99.1
[129] dbplyr_2.5.0                  ExperimentHub_2.10.0
[131] MatrixModels_0.5-4            survMisc_0.5.6
[133] crosstalk_1.2.1               digest_0.6.37
[135] permute_0.9-8                 Matrix_1.6-5
[137] dir.expiry_1.10.0             farver_2.1.2
[139] tzdb_0.5.0                    AnnotationFilter_1.26.0
[141] reshape2_1.4.4                yulab.utils_0.2.0
[143] exactRankTests_0.8-35         viridis_0.6.5
[145] rpart_4.1.23                  glue_1.8.0
[147] cachem_1.1.0                  BiocFileCache_2.10.2
[149] polyclip_1.10-7               MCPcounter_1.2.0
[151] Hmisc_5.2-3                   generics_0.1.4
[153] mvtnorm_1.3-3                 statmod_1.5.0
[155] ScaledMatrix_1.10.0           GEOquery_2.70.0
[157] carData_3.0-5                 vroom_1.6.5
[159] gson_0.1.0                    snow_0.4-4
[161] dqrng_0.4.1                   quantiseqr_1.10.0
[163] siggenes_1.76.0               basilisk_1.14.3
[165] graphlayouts_1.2.2            gtools_3.9.5
[167] readxl_1.4.5                  preprocessCore_1.64.0
[169] ggsignif_0.6.4                shiny_1.11.1
[171] GenomeInfoDbData_1.2.11       R.utils_2.13.0
[173] rhdf5filters_1.14.1           RCurl_1.98-1.17
[175] memoise_2.0.1                 rmarkdown_2.29
[177] pheatmap_1.0.13               R.methodsS3_1.8.2
[179] limSolve_2.0.1                reshape_0.8.10
[181] illuminaio_0.44.0             ggpp_0.5.9
[183] stringfish_0.17.0             km.ci_0.5-6
[185] rstudioapi_0.17.1             cluster_2.1.6
[187] hms_1.1.3                     colorspace_2.1-1
[189] rlang_1.1.6                   quadprog_1.5-8
[191] ggpmisc_0.6.2                 DelayedMatrixStats_1.24.0
[193] sparseMatrixStats_1.14.0      ggforce_0.5.0
[195] mgcv_1.9-1                    xfun_0.52
[197] e1071_1.7-16                  abind_1.4-8
[199] GOSemSim_2.28.1               tibble_3.3.0
[201] interactiveDisplayBase_1.40.0 treeio_1.26.0
[203] Rhdf5lib_1.24.2               readr_2.1.5
[205] bitops_1.0-9                  promises_1.3.3
[207] scatterpie_0.2.5              RSQLite_2.4.2
[209] qvalue_2.34.0                 proxy_0.4-27
[211] fgsea_1.35.6                  DelayedArray_0.28.0
[213] compiler_4.3.3                prettyunits_1.2.0
[215] beachmat_2.18.1               SparseM_1.84-2
[217] polynom_1.4-1                 graphite_1.48.0
[219] Rcpp_1.1.0                    AnnotationHub_3.10.1
[221] MASS_7.3-60.0.1               progress_1.2.3
[223] R6_2.6.1                      fastmap_1.2.0
[225] fastmatch_1.1-6               rstatix_0.7.2
[227] ensembldb_2.26.0              rsvd_1.0.5
[229] nnet_7.3-19                   gtable_0.3.6
[231] latticeExtra_0.6-30           deldir_2.0-4
[233] htmltools_0.5.8.1             RcppParallel_5.1.10
[235] bit64_4.6.0-1                 lifecycle_1.0.4
[237] S7_0.2.0                      infiltR_0.1.0
[239] MOFA2_1.12.1                  restfulr_0.0.16
[241] sass_0.4.10                   vctrs_0.6.5
[243] ggfun_0.2.0                   bslib_0.9.0
[245] pillar_1.11.0                 magick_2.8.7
[247] jsonlite_2.0.0                GetoptLong_1.0.5