15 Figure S3
15.1 Figure S3 code
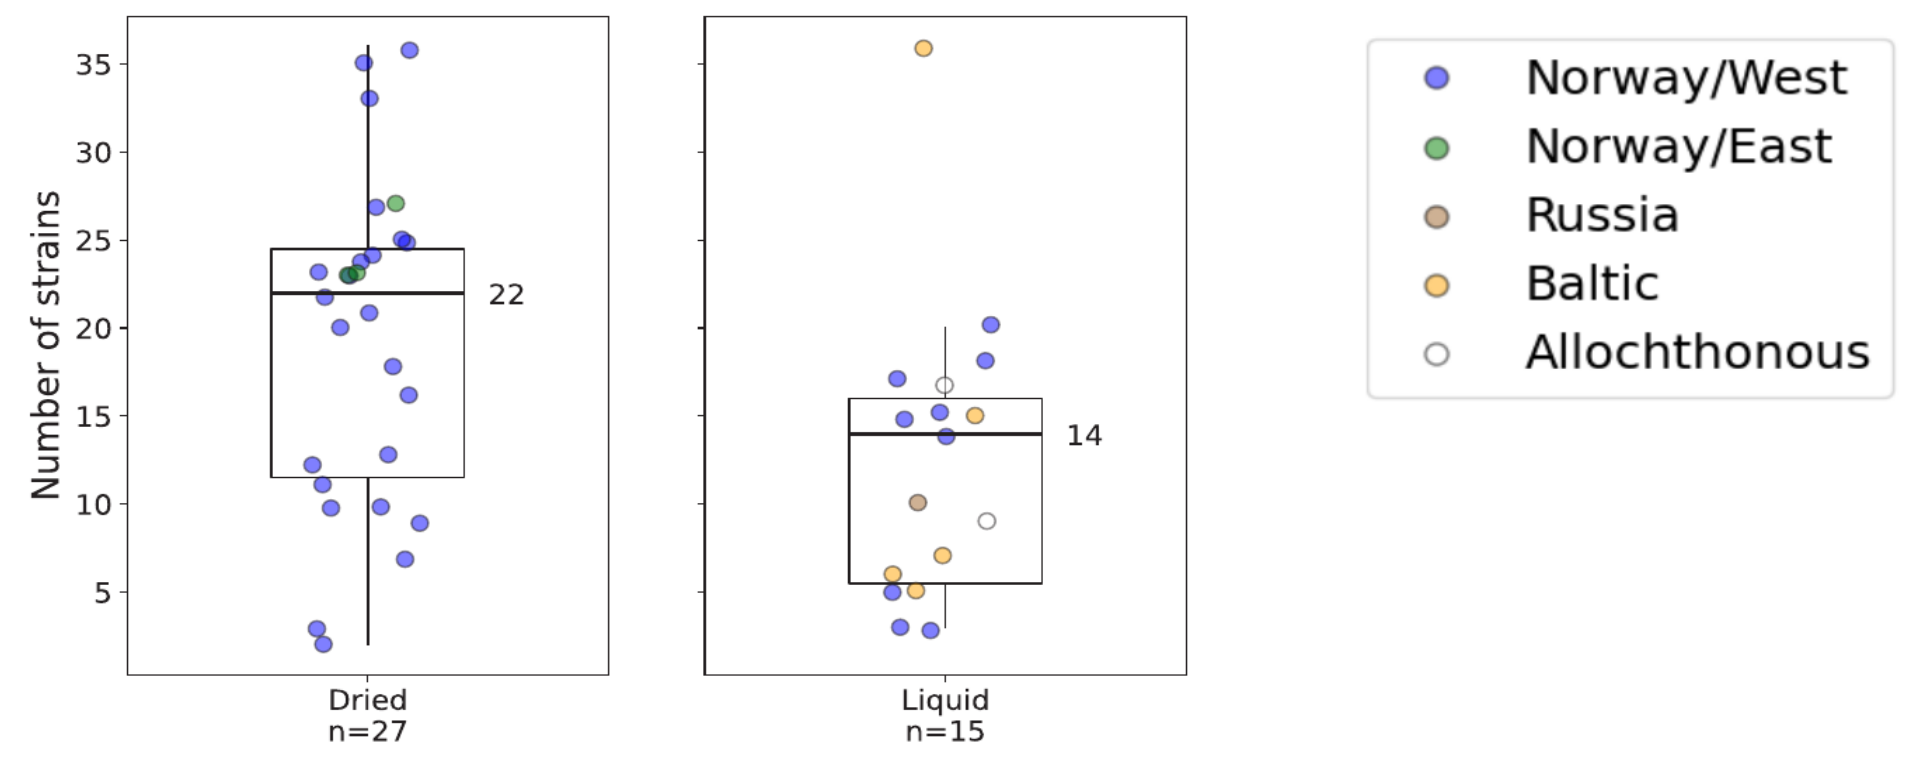
15.2 Figure S3 plot
15.3 Session Information
Note
R version 4.3.3 (2024-02-29)
Platform: x86_64-pc-linux-gnu (64-bit)
Running under: Ubuntu 24.04.3 LTS

Matrix products: default
BLAS:   /usr/lib/x86_64-linux-gnu/blas/libblas.so.3.12.0
LAPACK: /usr/lib/x86_64-linux-gnu/lapack/liblapack.so.3.12.0

locale:
 [1] LC_CTYPE=en_US.UTF-8    LC_NUMERIC=C            LC_TIME=C
 [4] LC_COLLATE=en_US.UTF-8  LC_MONETARY=C           LC_MESSAGES=en_US.UTF-8
 [7] LC_PAPER=C              LC_NAME=C               LC_ADDRESS=C
[10] LC_TELEPHONE=C          LC_MEASUREMENT=C        LC_IDENTIFICATION=C

time zone: Europe/Brussels
tzcode source: system (glibc)

attached base packages:
[1] grid      stats     graphics  grDevices utils     datasets  methods
[8] base

other attached packages:
[1] magick_2.8.7  ggplot2_3.5.2

loaded via a namespace (and not attached):
 [1] vctrs_0.6.5        cli_3.6.5          knitr_1.50         rlang_1.1.6
 [5] xfun_0.52          generics_0.1.4     jsonlite_2.0.0     glue_1.8.0
 [9] htmltools_0.5.8.1  scales_1.4.0       rmarkdown_2.29     evaluate_1.0.4
[13] tibble_3.3.0       fastmap_1.2.0      yaml_2.3.10        lifecycle_1.0.4
[17] compiler_4.3.3     dplyr_1.1.4        RColorBrewer_1.1-3 Rcpp_1.1.0
[21] htmlwidgets_1.6.4  pkgconfig_2.0.3    farver_2.1.2       digest_0.6.37
[25] R6_2.6.1           tidyselect_1.2.1   dichromat_2.0-0.1  pillar_1.11.0
[29] magrittr_2.0.3     withr_3.0.2        tools_4.3.3        gtable_0.3.6